Despite the proliferation of new 2D techniques over the past four decades, one of the most commonly used experiments is the very first one to have come into existence, COSY1. It’s easy to see why it’s withstood the test of time: firstly, it’s an extremely useful experiment, providing a direct and easy way of establishing “through bond” proton-proton connectivities (“this hydrogen is near or next to that hydrogen”); secondly, because it’s a homonuclear 2D experiment (that is to say, it correlates protons with protons) its’s a very sensitive one. The high sensitivity also means that it’s a quick experiment to run, particularly if the experiment uses gradients for coherence selection (more on that below and in a future blog post).
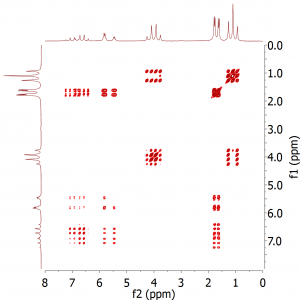
Example COSY spectra recorded on Spinsolve can be found elsewhere on the Magritek website, but a typical example is also shown in Figure 1 below, recorded on a sample of ethyl crotonate. The sequence used to collect this spectrum utilizes gradients, meaning that it was run using only a single scan per t1 increment, and with 512 increments it only took 15 minutes to run.
Fig. 1. COSY spectrum of ethyl crotonate, collected using gradients and 512 t1 increments.
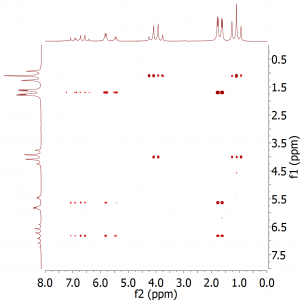
Now, as useful as the standard COSY experiment is, sometimes we might want more resolution (narrower peaks), for example, when the spectrum is crowded. Fortunately, help is at hand in the form of the Constant-Time COSY experiment2. I shan’t go into the inner workings of this or other constant-time experiments here, but the important thing to know is that the J-splittings of the signals in the indirect (F1) dimension are removed, making the signals much narrow in that dimension. Figure 2 below shows a constant-time COSY recorded on the same sample of ethyl crotonate, also using gradients and with a 15-minute experiment time.
Fig. 2. Constant-time COSY of ethyl crotonate. Note that the splittings in the F1 (vertical) dimension have been removed, drastically improving the resolution of the experiment.
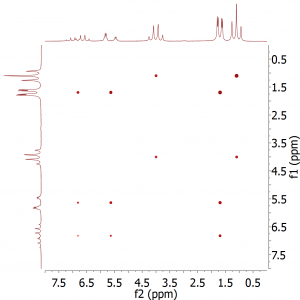
As you can clearly see, the resolution in F1 is much increased over the standard COSY experiment. Want even higher resolution? Well, there’s a very nice data processing technique called covariance processing (standard in Mnova) that can be applied to these data. The result is a spectrum in which the J-splittings are removed in both dimensions of the COSY spectrum, giving us what is effectively a double “pure shift” COSY spectrum, where each signal is represented by just a single peak rather than a mulitplet. Figure 3 below shows the same spectrum as in Figure 2, but this time processed using covariance.
Fig. 3. Constant-time COSY of ethyl crotonate obtained after applying covariance processing to the spectrum shown in Fig. 2.
Want to learn more about constant-time COSY and other pure shift experiments? Let us know!
References
- P. Aue, E. Bartholdi and R. R. Ernst, J. Chem. Phys. 64, 2229 (1976).
- A. Aguilar, J. Cassani, M. Delbianco, R. W. Adams, M. Nilsson, and G. A. Morris, Chem. Eur. J. 21, 6623 (2015).


