Food
Quality control is a constant challenge in food science and technology. The Spinsolve benchtop NMR spectrometer is is an affordable solution for industrial use.
Food
Quality control is a constant challenge in food science and technology. The Spinsolve benchtop NMR spectrometer is is an affordable solution for industrial use.
Benchtop NMR Spectroscopy On Liquid Food Samples
Quality control is a constant challenge in food science and technology. High resolution proton NMR spectroscopy has been extensively used to characterize liquid foodstuffs, but due to the high cost of large superconducting NMR systems these methods have largely been limited to research labs.
The Spinsolve benchtop NMR spectrometer can be used to analyse commercial liquid food samples. It is worth noting that NMR can measure samples that are cloudy, coloured or bubbly, and does not require the traditional sample preparation of other analytical techniques. The samples can be taken straight from their containers and scanned without any further purification, dilution or other treatment.
Dairy products
The graph below shows how the measured values correlate with the labeled fat content for milk and cream samples with different fat contents.
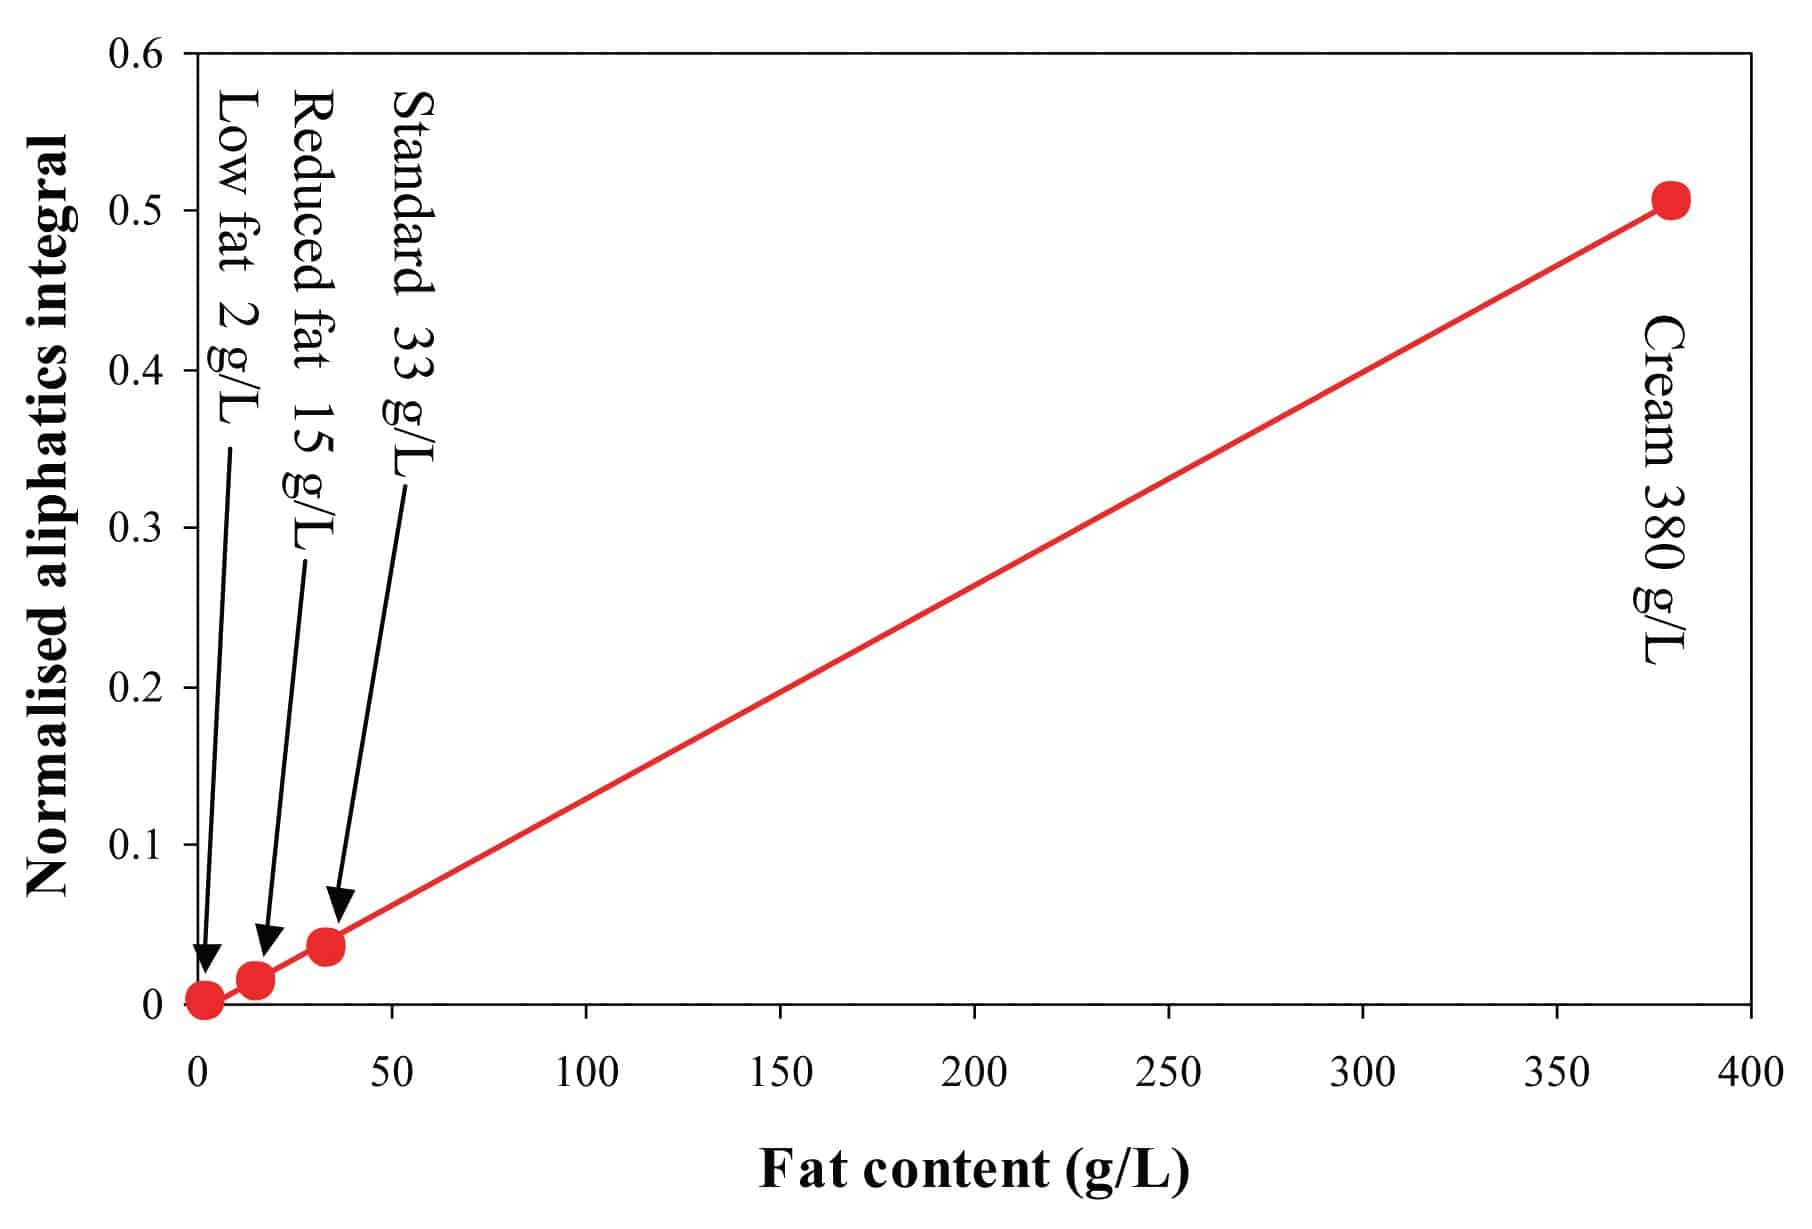
The Spinsolve Ultra benchtop NMR spectrometer can be easily used to look at some of the main components in milk, like water, fat, and lactose. Milk contains around 87% of water, therefore the water signal dominates the spectrum and overlaps with the signal of some of the other components in the sample. Running a PRESAT experiment to suppress the water peak allows one to resolve the lactose and fat signals to perform an accurate quantification. Figure 1 shows the results of such measurements carried out on eight different commercial milk brands.
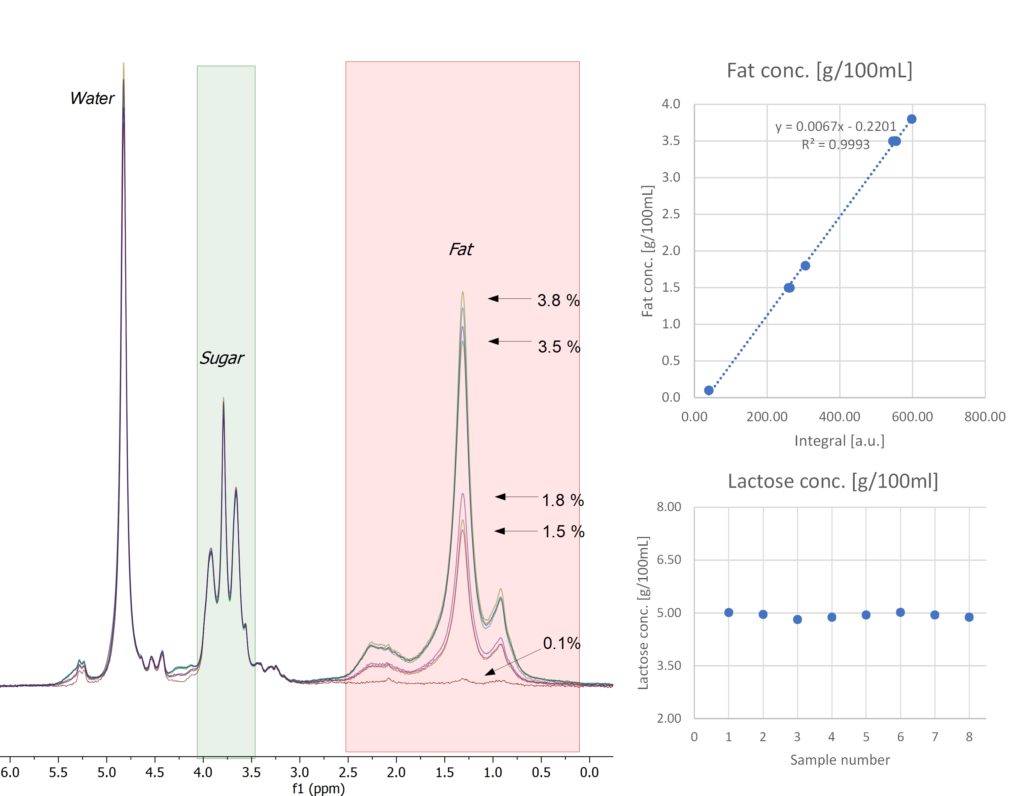
Figure 1: 60 MHz 1H NMR spectra of eight milk samples measured on Spinsolve 60 Ultra with solvent suppression (left). Plots on the right show their contents of fat (top) and lactose (bottom) calculated with the help of calibration curves.
Fat and lactose content obtained by NMR are in very good agreement with the values stated on the respective label of the products (Table 1). Water content in milk can be then calculated from the spectrum measured without solvent suppression, taking into account the fat and lactose content determined first from the PRESAT measurement.

Table 1: Fat and lactose content calculated for different brands of milk and compared to the values stated on the labels.
Click here to read the full application note.
Vegetable oils
| Soy bean canola blend | Soy bean | Olive | |
|---|---|---|---|
| Olefins (%) | 9.3 | 10.2 | 6.2 |
| Methyl esters (%) | 3.4 | 3.8 | 3.3 |
| Linole(n)ics (%) | 3.8 | 4.7 | 1.6 |
| Oleics (%) | 17.9 | 17.1 | 17.4 |
| Aliphatics (%) | 65.3 | 64.2 | 71.5 |
| Total (%) | 100 | 100 | 100 |
Alcoholic beverages
Ethanol shows a typical signature in the NMR spectrum, as shown below for different alcoholic beverages.
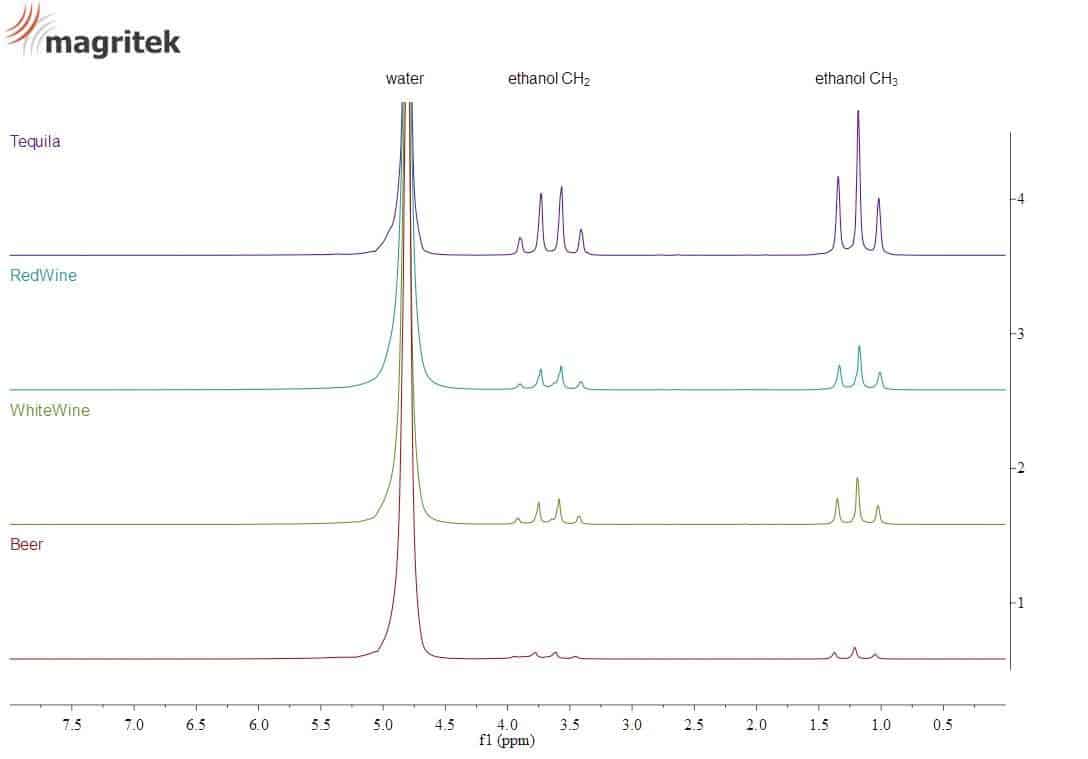
This signal can be used to measure the alcohol content of an unknown sample.
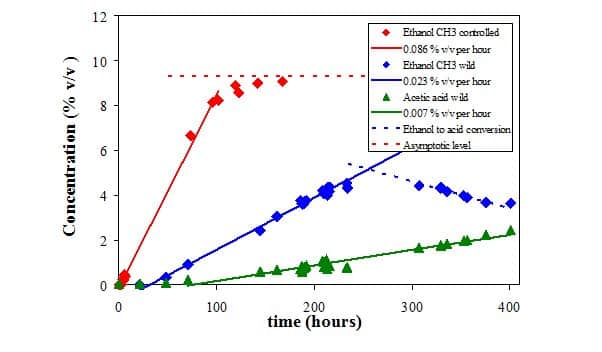
In industrial processes it is important to monitor the fermentation progress, as uncontrolled fermentation through contamination can spoil entire batches of a product. Most analytical methods require the sample to be clear and/or purified, or dissolved in a deuterated solvent. The analysis with Spinsolve is different, as the sample can be taken straight from the vessel without further processing.
The figure below shows the NMR spectra of fresh apple juice, as well as apple cider from wild and controlled fermentation after 10 days of fermentation. The juice and cider spectra are dominated by the prominent water peak, but the vertical expansion by a factor 50 reveals the presence of smaller peaks, which can all be assigned. In order to aid peak assignment, the spectrum of a 99% ethanol/water mixture is shown as well.
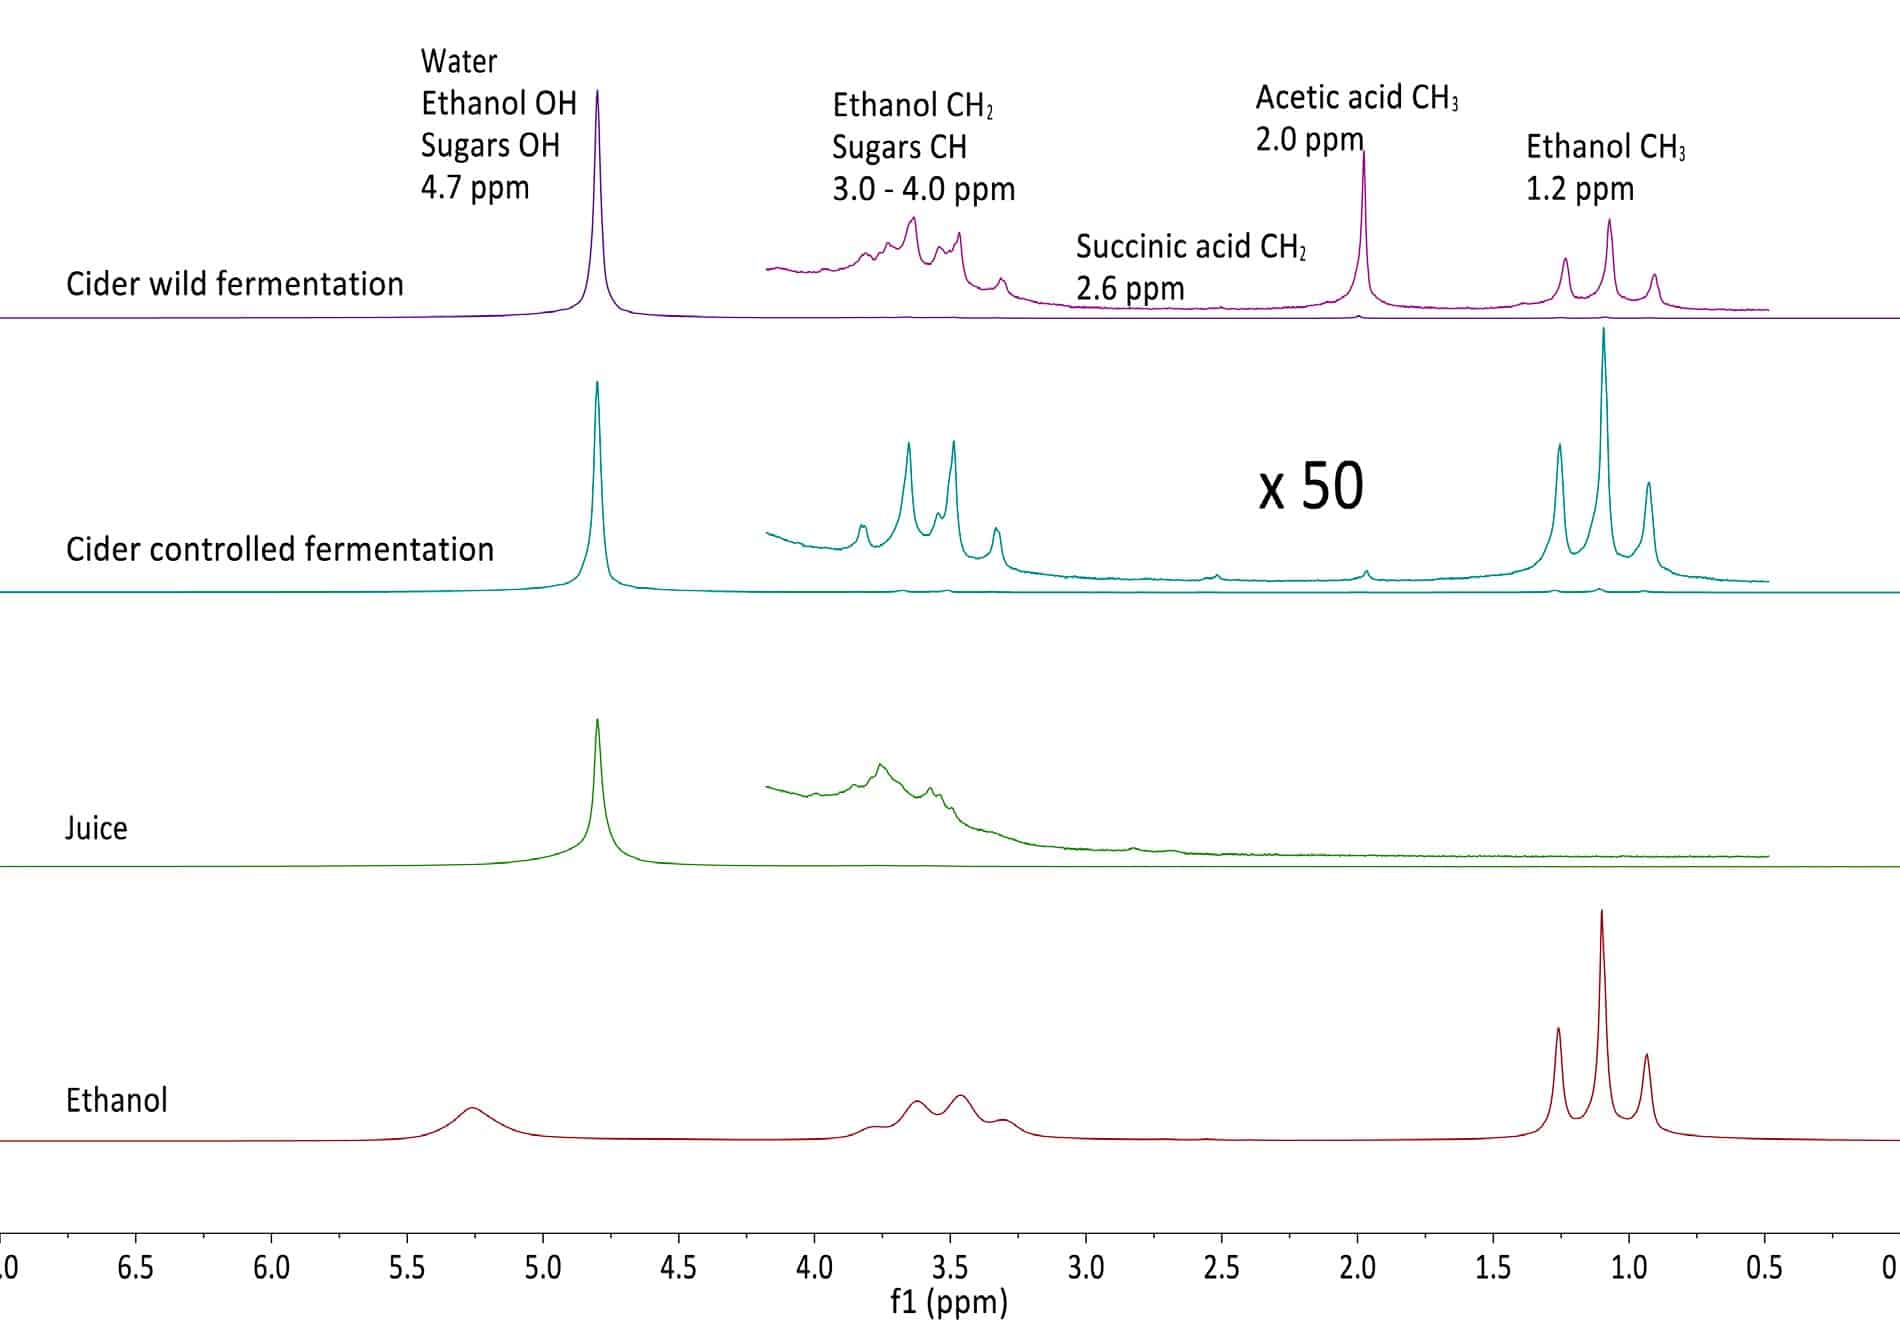
From these data it is evident that the wild fermentation produces large amounts of acetic acid as an unwanted byproduct. The graph below shows the time evolution of both controlled and wild fermentation with the respective product conversion rates. Read more…
Coffee authenticity
We all know the aroma of roasted coffee beans and the taste of freshly brewed coffee or espresso, as coffee is one of the most popular drinks all around the world. For example in Germany around 150 liters are consumed per person each year. The two main utilized coffee species worldwide are Arabica with around 75% and Robusta. Of those two Arabica coffee is often more highly regarded in taste and quality compared to Robusta. Hence, Robusta beans tend to be lower in price. On the other hand, Robusta coffee has about 50% higher caffeine content. Nonetheless, because of the lower price, Robusta beans are often used in commercial coffee blends as a substitution for Arabica beans, which leaves room for commercial food fraud.
To tackle this problem ground coffee beans can be extracted and subsequently analysed by a variety of analytical methods, one of which is NMR spectroscopy. Below we present the 1D 1H spectra of Arabica and Robusta coffee samples dissolved in CDCl3. The spectra has been collected on our new Spinsolve© 80 MHz Ultra system. These two types of beans can be differentiated by a specific marker molecule (16-OMC, 16-O-Methylcafestol), which is only present in the Robusta coffee beans. This marker molecule can be clearly detected by 1D 1H NMR spectroscopy. From the several signals expected for this molecular structure, the one at 3.16 ppm is the most visible and does not overlap with other signals present in the spectrum. By checking for the presence of this specific peak in the NMR spectrum, it is possible to detect commercial food fraud in Arabica/Robusta blended coffees. The method described in this post makes it possible to detect an amount of Robusta as low as 2% in the blended samples.
The coffee samples were extracted with CDCl3 using the same conditions for both coffee types. The observed suspensions were filtered after the extraction time and then introduced into standard 5mm NMR tubes. The spectra were then measured with 4 scans with a total measurement time of 1 min.
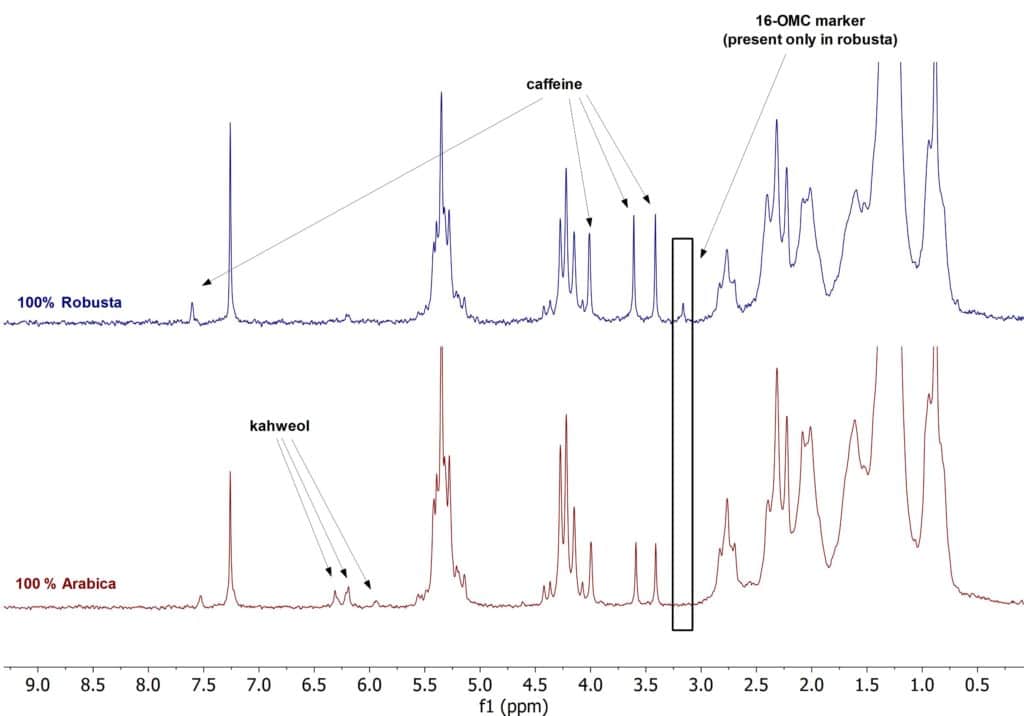
Figure 1. 1H NMR stack plot of coffee samples in CDCl3
Caffeine quantification
A second set of measurements was performed to quantify the amount of caffeine in the freshly prepared coffee. The below figure shows a 1D 1H spectra stack plot of a 100% Arabica, 100% Robusta and 100% decaffeinated Arabica freshly brewed with water. For the samples in H2O, a normal cup of coffee was prepared with our in-house coffee machine. From the resulting coffee a 0.5 mL sample was taken and directly filtered into a standard 5mm NMR tube. The spectra were then acquired with 64 scans utilizing a solvent suppression sequence with a total measurement time of 17 min. Here, we could quantify amounts of caffeine in the 100% Arabica coffee of 61 mg/100mL, in the 100% Robusta coffee of 113 mg/100mL and in the 100% decaffeinated Arabica coffee of 5 mg/100 mL, respectively. The possibility to measure the caffeine content in coffee allows one to discriminate between normal and decaffeinated beans. It is also useful to certify the amount of caffeine in specific blended coffee. This is a straightforward method that does not require any special sample preparation, as just water is used for the extraction. Moreover, no complex calibration is required for the analysis.
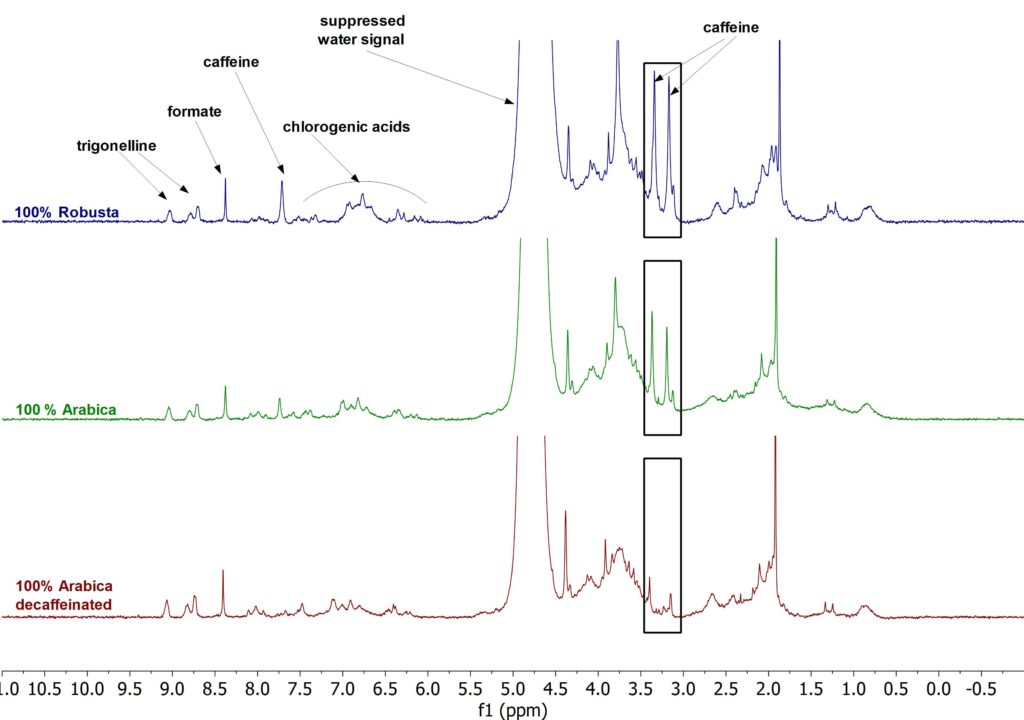
Figure 2. 1H NMR stack plot of coffee samples in H2O
Honey is a well-known natural food source, made by bees using nectar from flowers. Typically honey is classified by color and flavor depending on the type of flower from which the nectar was harvested from.
Pure honey is a complex supersaturated solution containing 80% sugars and unique combination of chemical compounds such as phenolic, flavonoids, and volatiles suspended in water. Every honey has antimicrobial properties due to hydrogen peroxide, which is a naturally present mild antiseptic. Hydrogen peroxide is known to be unstable and can be quickly destroyed in the presence of heat, light, and body enzymes which, reduces its medicinal properties.
Manuka honey is obtained from the nectar of the flower of the manuka bush (Leptospermum scoparium), which is native to New Zealand and some parts of Australia. It is widely recognised for its non-peroxide antimicrobial properties and specific taste. The chemical compounds that make Manuka honey so special are believed to be Methylglyoxal (MGO), Leptosperin and Dihydroxyacetone (DHA). Methylglyoxal is a naturally occurring dicarbonyl compound produced through the conversion of DHA during maturation and aging of honey and is believed to be the major contributor to manuka honey’s non-peroxide antibacterial activity. It undergoes a spontaneous reaction with water, and it has been estimated that in aqueous solution less than 1% of the MGO remains unreacted. It predominantly forms the two compounds methylglyoxal monohydrate and methylglyoxal dihydrate as shown in Fig. 1. Due to its reactivity, low molecular mass and lack of UV chromophore, the direct detection of MGO in manuka honey is problematic using conventional methods [1].

Figure 1: The structures of the MGO molecule and the two hydrates.
The quality of Manuka honey is specified by the UMF (Unique Manuka Factor) grading system, which represents the unique signature compounds characteristic of this honey, including Leptosperin, DHA and MGO. Higher UMF numbers stipulate a higher health benefit. For example, UMF-16 honey contains roughly 570 mg MGO per kg of dry honey [2].
In this work, we identified methylglyoxal hydrates and quantified them using an internal standard (maleic acid) with the help of benchtop NMR Spectroscopy. To perform this measurement, two sets of samples were prepared:
1. Methylglyoxal dissolved in a 100 mM Maleic Acid in D2O solution.
2. 100 mg manuka honey (UMF-16) dissolved in 1 mL of D2O .
0.5 mL of each sample was taken into three different standard 5 mm NMR tubes. The Proton spectra were collected on a Spinsolve 60 MHz benchtop NMR system using 256 scans, 15 s repetition time, with a total acquisition time of 16 minutes per spectrum. The Proton spectrum of sample 2 (UMF-16 manuka honey) is shown in Fig. 2. We can immediately identify the sugar peaks, but also smaller peaks at 7.4, 2.3 and 1.4 ppm that can be assigned to the unique manuka honey ingredients leptosperin, MGO mono- and dihydrate [3].
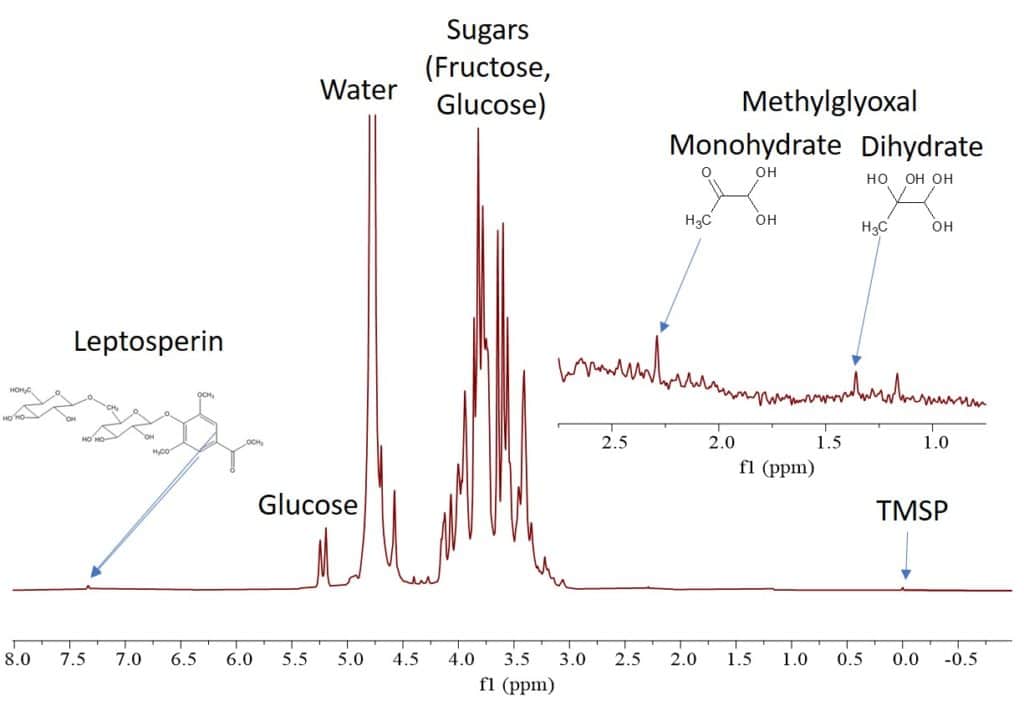
Figure 2: Proton NMR spectrum of UMF-16 manuka honey dissolved in D2O.
By using the qNMR method [4], we can quantify the MGO content in the UMF-16 manuka honey sample. For this we prepared sample 1 as external standard. Figure 3 shows the spectra of the two samples in the range of the MGO peaks.

Figure 3: Proton NMR spectra of the two samples zoomed into range of the MGO peaks.
Sample 1 contained a precisely prepared amount of maleic acid as internal standard as specified in Table 1. By integrating the MGO peaks, we can calculate the MGO concentration of each sample. The total MGO concentration is listed in the last row of Table 1.

Table 1: Mass concentrations in mg/mL as obtained by qNMR of MGO in the two samples.
Sample 2 contains 100 mg of untreated manuka honey with a total of 46 ug MGO per mL. Considering that honey typically contains 20% of moisture, we have 80 mg of dried honey in the sample. Therefore the MGO concentration as measured by qNMR is 0.046/80*1000000=575 mg/kg. This measured value is in excellent agreement with the expected MGO concentration for UMF-16 manuka honey [2].
Please access the pdf version of the application note here.
References
[1] J. A. Donarski, D. P. T. Roberts, A. J. Charlton, Anal. Methods, 2010, 2, 1479-1483
[2] https://newzealandhoneyco.com/pages/mgo-vs-umf-calculator-manuka-honey
[3] M. Spiteri, K. M. Rogers, E. Jamin, F. Thomas, S. Guyader, M. Lees, D. N. Rutledge, Food Chem., 2017, 217, 766-772
[4] https://magritek.com/2016/09/12/quantitative-benchtop-nmr/
Further reading
Download Resources
- App Note Determination of fat, lactose and water content in milk
- App Note Identification and quantification of methylglyoxal in Manuka honey
- App Note Monitoring Fermentation by Benchtop NMR
- Blog Post Authenticity testing and caffeine quantification of coffee with benchtop NMR
- Blog Post Measurement of oil adulteration
- Blog Post Characterizing Fatty Acids with advanced multinuclear NMR methods