We all know the aroma of roasted coffee beans and the taste of freshly brewed coffee or espresso, as coffee is one of the most popular drinks all around the world. For example in Germany around 150 liters are consumed per person each year. The two main utilized coffee species worldwide are Arabica with around 75% and Robusta. Of those two Arabica coffee is often more highly regarded in taste and quality compared to Robusta. Hence, Robusta beans tend to be lower in price. On the other hand, Robusta coffee has about 50% higher caffeine content. Nonetheless, because of the lower price, Robusta beans are often used in commercial coffee blends as a substitution for Arabica beans, which leaves room for commercial food fraud.
To tackle this problem ground coffee beans can be extracted and subsequently analysed by a variety of analytical methods, one of which is NMR spectroscopy. Below we present the 1D 1H spectra of Arabica and Robusta coffee samples dissolved in CDCl3. The spectra has been collected on our new Spinsolve© 80 MHz Ultra system. These two types of beans can be differentiated by a specific marker molecule (16-OMC, 16-O-Methylcafestol), which is only present in the Robusta coffee beans. This marker molecule can be clearly detected by 1D 1H NMR spectroscopy. From the several signals expected for this molecular structure, the one at 3.16 ppm is the most visible and does not overlap with other signals present in the spectrum. By checking for the presence of this specific peak in the NMR spectrum, it is possible to detect commercial food fraud in Arabica/Robusta blended coffees. The method described in this post makes it possible to detect an amount of Robusta as low as 2% in the blended samples.
The coffee samples were extracted with CDCl3 using the same conditions for both coffee types. The observed suspensions were filtered after the extraction time and then introduced into standard 5mm NMR tubes. The spectra were then measured with 4 scans with a total measurement time of 1 min.
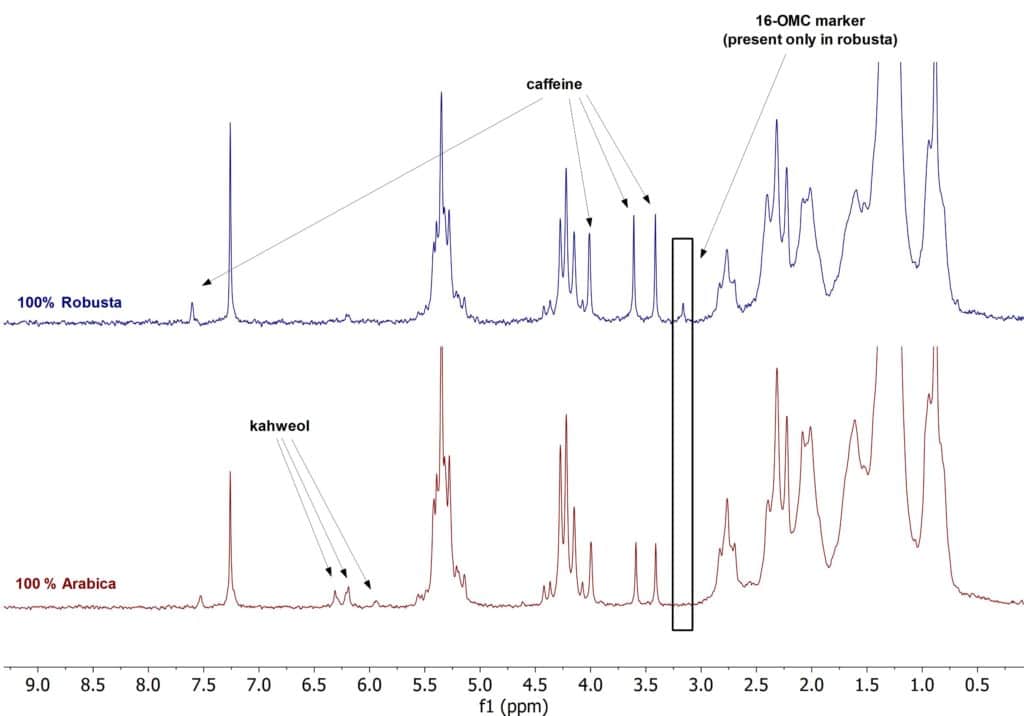
Figure 1. 1H NMR stack plot of coffee samples in CDCl3
A second set of measurements was performed to quantify the amount of caffeine in the freshly prepared coffee. The below figure shows a 1D 1H spectra stack plot of a 100% Arabica, 100% Robusta and 100% decaffeinated Arabica freshly brewed with water. For the samples in H2O, a normal cup of coffee was prepared with our in-house coffee machine. From the resulting coffee a 0.5 mL sample was taken and directly filtered into a standard 5mm NMR tube. The spectra were then acquired with 64 scans utilizing a solvent suppression sequence with a total measurement time of 17 min. Here, we could quantify amounts of caffeine in the 100% Arabica coffee of 61 mg/100mL, in the 100% Robusta coffee of 113 mg/100mL and in the 100% decaffeinated Arabica coffee of 5 mg/100 mL, respectively. The possibility to measure the caffeine content in coffee allows one to discriminate between normal and decaffeinated beans. It is also useful to certify the amount of caffeine in specific blended coffee. This is a straightforward method that does not require any special sample preparation, as just water is used for the extraction. Moreover, no complex calibration is required for the analysis.
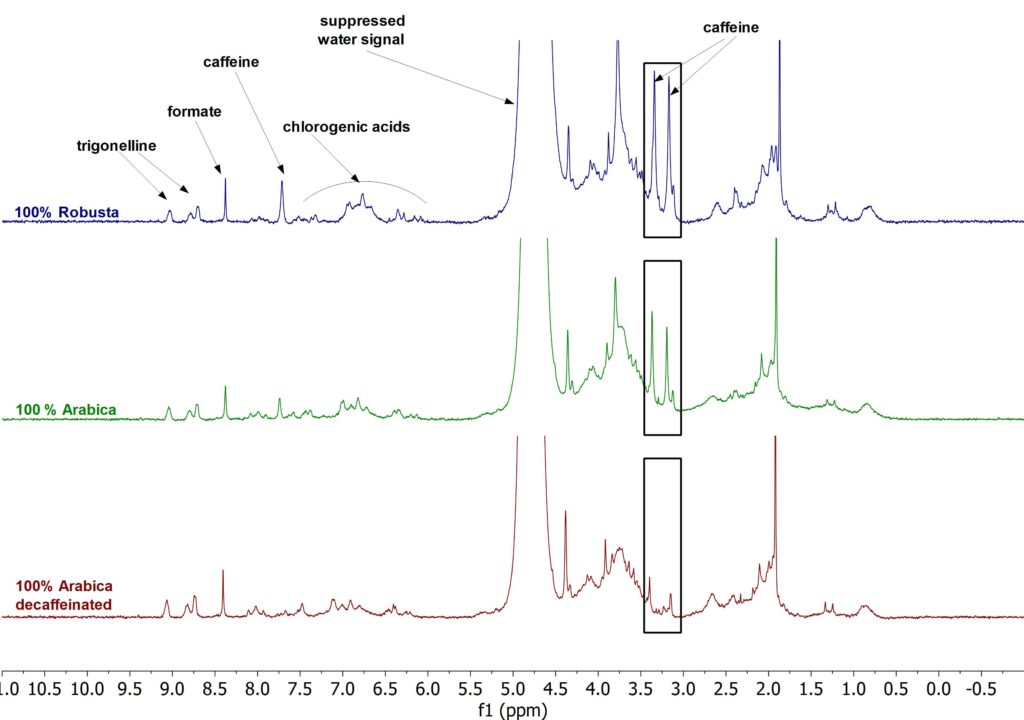
Figure 2. 1H NMR stack plot of coffee samples in H2O