Polymers
Spinsolve benchtop NMR spectrometers are a valuable tool to characterize polymers at different stages during production, from the structure verification of the monomers before the polymerization to quality control of the final product.
Polymers
Spinsolve benchtop NMR spectrometers are a valuable tool to characterize polymers at different stages during production, from the structure verification of the monomers before the polymerization to quality control of the final product.
Polymers are long molecular chains made of small building blocks or monomers during a polymerisation reaction. They are found in mass-manufactured products (plastic bags, shoes, textiles, paints, adhesives, foams, etc), and also used in advanced applications, like drug delivery systems or smart surfaces (stimuli responsive polymers). Different polymers have their own properties and functionalities that strongly correlate with their molecular structure. Therefore, the control of their molecular composition and weight during the synthesis process are key for the successful design of materials optimized for defined applications. In this page we present several examples that demonstrate how Benchtop NMR spectroscopy can provide chemical and physical information useful for polymer characterization in a simple way.
Determination of the molecular weight of polymers by end-group analysis
One of the main parameters determining the properties of a polymer is the degree of polymerization and the directly related molecular weight. The degree of polymerization (DP) or number of repeating units can be determined by comparing in the 1D 1H spectra the integral of the end-group and the integral of the repeating chain unit of interest by using this equation:

The molecular weight of the polymer can then easily be determined by multiplying the DP with the molecular weight of the repeating unit.


1D 1H spectra of polyethylene glycol (PEG) with a methoxy group acquired on a Spinsolve 80 MHz system.
The second example exhibits a poly ε-caprolactone polymer, which is functionalized with a Tosyl end group at both ends. Functional groups are introduced specifically for the molecular weight determination or for the dedicated synthesis of copolymers and/or post functionalization. In the current case the Tosyl-function can serve all these purposes.
As the polymer is terminated at both ends with the Tosylgroup the number of protons that needs to be considered is 2×4 = 8, hence the Mn of the polymer can be calculated as follows.


1D 1H spectra of poly(ε-caprolactone) end functionalized with a tosyl group on each chain end (calculated DP of 36, molecular weight of 4100 g/mol) acquired on a Spinsolve 60 MHz. R1 is depending on the bifunctional initiator used for the polymerization.
Determination of copolymer compositions by benchtop NMR
In the previous section we showed how benchtop NMR can be utilized to determine the molecular weight of polymers by using the ratio between the end-group and the backbone signals. The polymer examples shown there were so-called homopolymers as they are made from a single type of monomer. Most commodity plastics like polyethylene, polypropylene or polystyrene are of this type. However, there are as well many applications where more specific properties of polymers are desired. One way to tune such properties (mechanical, thermal, etc.) is the preparation of copolymers, which are made from two or more different monomers. The properties of these copolymers are defined by the characteristics of each monomer, but as well by the ratio of them within the copolymer. This molar ratio of the repeating units can simply be determined by NMR, setting the integrals of the monomer signals in relation to each other and considering the number of protons of each integrated region. In this way the monomer ratio can calculated using the following equation:

The first example is an amphiphilic block-copolymer of poly(ethylene glycol)-b-poly(lactic acid) (PEG-b-PLA), a biodegradable and biocompatible copolymer used in pre-clinical and clinical studies for the delivery of poorly water-soluble anticancer agents. This copolymer forms micelles in water, that encapsulates the hydrophobic molecules. By hydrolysis of the ester group, the copolymer degrades and liberates the encapsulated drug. By tuning the PEG/PLA ratio and molecular weight of the copolymer, the micelles size and degradation rate can be controlled. The 1D 1H spectrum of the copolymer shows the 4 protons of the PEG at around 3.6 ppm and for the PLA, 1H of the backbone at 5.2 ppm and 3H of the methyl group at 1.5 ppm. To obtain the ratio PLA/PEG, the equation can be written:

On the spectra, the methoxy end-group of the PEG at 3.4 ppm allows us to calculate the DP of PEG as well as his molecular weight:

Therefore, the DP of PLA is 173 x 3.21 = 555 and the MW is 555 x 144 ~ 8000 g/mol. The molecular weight of the PEG-b-PLA is of ~15650 g/mol.

1D 1H spectra of PEG-b-PLA recorded on a Spinsolve 80 MHz.
One other type of copolymer for medical application are poloxamers. These are synthetic tri-block copolymers composed of two poly(ethylene oxide) (PEO) blocks and one poly(propylene oxide) (PPO) block and possess temperature dependent self-assembling and thermo-gelling behavior. They form thermo-reversible hydrogels, which are used in drug delivery for ophthalmic administration. Before injection, the poloxamer (with the therapeutic and the excipients) is in solution at room temperature. However, once injected into the eye the formulation heats up to body temperature, turns into a gel, and immobilizes the therapeutic so that a higher residence time is achieved.
As the thermo-reversible behavior strongly depends on the molecular weight and the hydrophilic/hydrophobic molar ratio of the triblock copolymer, it is important to be able to determine the monomer ratio. In the 1D proton spectrum collected on a Spinsolve 80 spectrometer, the integral of the signal at ~ 3.6 ppm includes 4 protons of the PEO and 3 protons of the PPO. As the signal at ~ 1.2 ppm corresponds to the 3 protons of the PPO methyl group the following equation for the ratio of PEO/PPO can be applied:

1D 1H spectra of poloxamer with a molar ratio of PEO/PPO of 5.68 recorded on a Spinsolve 80 MHz.
For the third example of this section, we were provided with the cationic copolymer of poly(ethylene oxide)-b-poly(vinylbenzyl trimethylammonium chloride) (PEO-b-PVBTA) which was synthesized by Jakob Stensgaard Diget, Norway. Cationic polymers are used among others as delivery media for nucleic acid-based drugs. In his article [1] Dr Diget studied the kinetic pathways for coacervation and micelle formation between PEO-b-PVBTA and poly(sodium 4-styrene sulfonate). An important parameter for the success of the formation of stable micellar nanostructures is the molecular weight and the monomer ratio of PEO-b-PVBTA. Both parameters can now be determined with a single 1D proton measurement.
The 1D 1H spectrum below recorded on a Spinsolve 80 MHz is compared with a measurement performed on a 400 MHz system. Both spectra look similar, with broad signals for the polymer repeating units (b,d,e,f,g) a singlet for the methyl group which terminates the PEO block (a) and a multiplet of the two methyl groups in the junction between PEO and PVBTA (c). Calculations of the degree of polymerization of the VBTA unit (taking in account the integral values a and c) result in 31 for the 400 MHz and 27 for the Spinsolve, while the obtained PEO/PVBTA ratio is 1.42 for both systems.
The different examples shown here highlight the possibility to use benchtop NMR for the characterization of a variety of copolymers, which is reinforced by the excellent agreement with data collected on a high field system.

1D 1H spectra of PEO-b-PVBTA (Synthesized by Jakob Stensgaard Diget) recorded at 80 MHz (top) and 400 MHz (bottom).
Reference:
[1] Response of block copolyelectrolyte complexes to addition of ionic surfactants, Daria Kaczmarek, Jakob S. Diget, Bo Nyström, Gergő Gyulai, Róbert Mészáros, Tibor Gilányi, Imre Varga, Colloids and Surfaces A: Physicochemical and Engineering Aspects, 532 (2017), 290–296 https://doi.org/10.1016/j.colsurfa.2017.04.078.
Monomer Content
The knowledge of the monomer content can be of importance either during a polymerization in order to follow the progress of the reaction or of the final product, as residual monomers can be hazardous, impact the polymer properties, and accelerate degradation processes.
The Spinsolve NMR spectroscopy systems can be used to quantify the monomer content even in the presence of the protoaned solvents. The figure below shows spectra taken of mixtures of methyl-methacrylate (MMA) and poly (methyl methacrylate) (PMMA) in non-deuterated toluene. The signals of monomer and polymer can easily be distinguished in the spectra enabling a straightforward quantification. The inset in the graph shows that the monomer content determined by NMR is in excellent agreement with the gravimetrically determined content.

1D 1H spectra with carbon decoupling recorded on the Spinsolve 80 Ultra with different ratios of methylmethacrylate (MMA) and poly(methylmethacrylate) (PMMA) in non deuterated toluene. The integrals of the marked areas were used for quantification. The inset shows the content of MMA as a function of the gravimetrically determined MMA content.
The method can be extended to a wide range of polymers, as for example polyesters. The figure below shows the mixtures of ε-caprolactone (εCL) and poly(ε-caprolactone) (PCL)at different ratios. As for the previous example, the inset in the graph shows that the monomer content determined with the Spinsolve is in excellent agreement with the gravimetrically determined content.

1D 1H spectra recorded on the Spinsolve 80 with different ratios of ε-caprolactone (εCL) and poly(ε-caprolactone) (PCL). The integrals of the marked areas were used for quantification. The inset shows the content of ε-caprolactone as a function of the gravimetrically determined εCL content.
Furthermore, the same technique can be appliled to follow the conversion of different polymerization reactions in batch and in flow reactors online as demonstrated by Nicholas Warrens group from the University of Leeds (England) in the journal “Polymer Chemistry” (DOI: 10.1039/C9PY00982E). They investigated the polymerization of acrylamide and methyl methacrylate monomers in homogenous medium, as well in dispersion. Thanks to the build-in lock system of the Spinsolve spectrometers, deuterated solvents were not required for their study and the presaturation water suppression method allows them to get detailed kinetic information under different conditions.
In a further development step, the group of Tanja Junkers from the Monash University (Australia) developed a machine-assisted self-optimization platform to automatically screen polymerization in flow reactors and presents the results in “ACS Macro Letters” (DOI: 10.1021/acsmacrolett.9b00767). In this algorithm-assisted synthesis, there is no need for human interaction to screen polymerization kinetics with Inline NMR. RAFT polymerization of methylmethacrylate was demonstrated but this platform can be easily extended to a broad range of polymerizations type and monomers.
Diffusion Coefficients of Polymers
Diffusion coefficients decrease with the increase of the molecular weight of the molecule, see our previous blog post for more information. This is also true for polymers for which the self-diffusion constant is also correlated with its molecular weight. In the frame of this section, the correlation is show with lignin samples dissolved in DMSO.
Lignin is the third most abundant polymer in nature after cellulose and chitin and the one with the largest number of aromatic compounds. It is a by-product of the paper industry and these about 50 million tons are currently almost exclusively used for generating energy.
On the figure below, the linear relation between the molecular weight determined by SEC and the diffusion coefficient of lignin is demonstrated.

Diffusion coefficient (measured on a Spinsolve 43 MHz) versus molecular of lignin determined by SEC.
For further ready about the characterization of lignin with a benchtop NMR and the comparison of the diffusion coefficient determined on the Spinsolve and a high field system, please have a look to this publication:
Lignin analysis with benchtop NMR spectroscopy
Jerk Rönnols, Ernesto Danieli, Hélène Freichels and Fredrik Aldaeus, Holzforschung, (2019) DOI: 10.1515/hf-2018-0282
The same approach based on the molecular weight dependence of the self diffusion can as well be used to differentiate homopolymers from copolymers.
In the following example we are looking at the combination of polystyrene (PS) and poly(methyl methacrylate) (PMMA). It is well known that PS and PMMA form immiscible blends for which phase separation has been observed. In contrast, PS-b-PMMA copolymers undergo self-assembly and are used to form periodic nanostructures (like lamellae or cylindrical microdomains).
The 1D 1H spectrum can distinguish signals of PMMA and PS and the ratio of the polymer units can be determined. In the case of the PS-b-PMMA copolymer a PMMA/PS ratio of 1.13 is obtained (see section copolymer composition).

1D 1H spectrum of PS-b-PMMA acquired on the Spinsolve 80 MHz.
However, with a 1D Spectrum it is typically not possible to distinguish between blends and the corresponding copolymer as back bone signals will be the same. To distinguish between blends and polymers one can make use of the fact that the diffusion coefficients of the polymers will be different. In NMR Pulsed Field Gradients (PFG) can be used to measure the different self-diffusion coefficients. This type of experiments is referred to as Diffusion Ordered SpectroscopY (DOSY). Please have a look at our previous blogpost on DOSY.
Below in the DOSY spectrum (a) of the copolymer reveals two signals that possess the same diffusion coefficient as they are on the same horizontal line, indicating that the signals belong to the same macromolecule, in this case PS-b-PMMA with a diffusion coefficient of 1.06 10-10 m2 s-1.
In the DOSY spectra (b) of the mixture of the homopolymers, the two signals possess different diffusion coefficients: a lower one belonging to PS (D = 5.41 10-11 m2 s-1) and a higher one belonging to PMMA (D = 3.28 10-10 m2 s-1).
In a further example we mixed the copolymer with one of the homopolymers. As shown in the DOSY (c) for a mixture of PS-b-PMMA and PMMA, the DOSY spectrum reveals two signals on the horizontal line from the copolymer PS-b-PMMA (D = 1.16 10-10 m2 s-1) and an additional signal of PMMA corresponding to the faster diffusing homopolymer (D = 3.30 10-10 m2 s-1).
These DOSY results show a simple way to distinguish between covalently bonded PS-b-PMMA chains and the individual homopolymers using benchtop NMR in combination with pulsed field gradients.

DOSY spectra acquired on the Spinsolve 80 of a) PS-b-PMMA; b) a mixture of PS and PMMA and c) a mixture of PMMA and PS-b-PMMA.
Ethylene Propylene Diene Monomer (EPDM)
Ethylene Propylene Diene Monomer (EPDM) is a synthetic terpolymer rubber prepared from ethylene, propylene, and non-conjugated diene monomers that are incorporated in the polymer chain to enable crosslinking via vulcanization. After polymerization and purification, free diene monomer can remain in the copolymer. Detection and quantification of this monomer is important as it impacts the vulcanization process and with it, the property of the material. The 1H NMR spectrum of the polymer (see Figure 1) shows in the aliphatic region the signals of ethylene and propylene with a ratio n/m = DPPropylene/DPEthylene = 0.87 (neglecting the diene ratio, see Figure 1 for calculation). By zooming in a factor of about 200, the allyl signals can be observed.
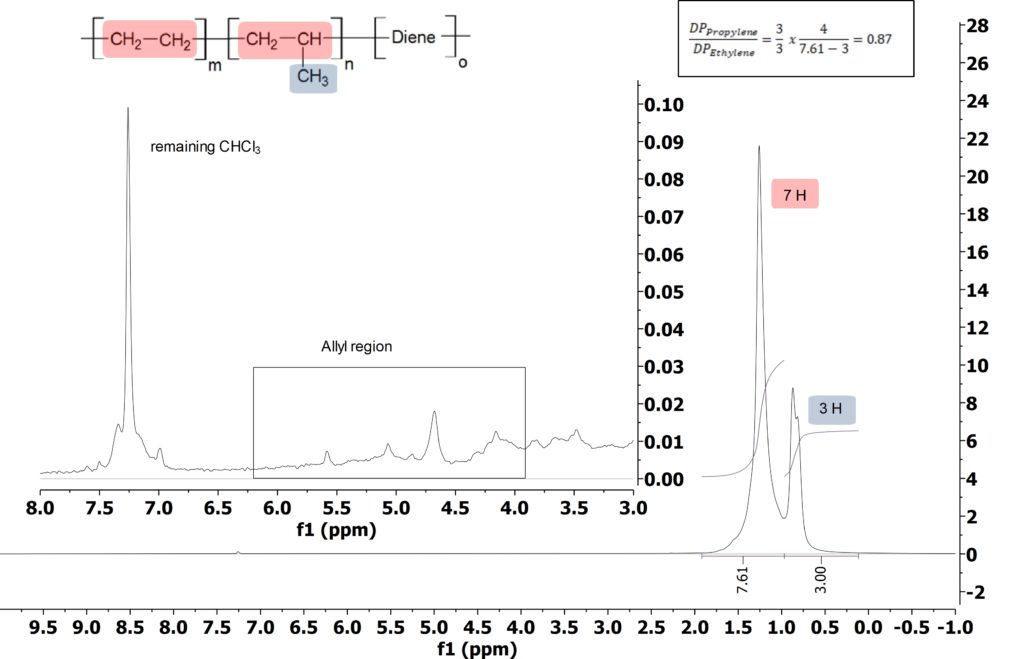
Figure 1: 1H spectra of EPDM in CDCl3 acquired on the Spinsolve 80.
To assign the allyl region a diffusion filter was applied on the EPDM sample. In this way, only the signals of the macromolecules with small diffusion coefficients remain (Figure 2 b). By comparing the spectra with Figure 2a without diffusion filter, the allyl signals of EPDM could be easily assigned (signal s3 in Figure 2). Next, to properly assign the allyl signals of the small molecules, iodine bromide (IBr) was added to the polymer solution. This reactant is well known to react specifically with double bonds. The comparison of the 1H NMR spectra before (Figure 2a) and after (Figure 2c) allows one to unambiguously assign them (see Figure 2, signals marked with vertical lines).
Quantification of free versus bonded allyl protons is then easily performed by integrating the three signals s1, s2, and s3, and calculating the ration of s1+s2 to s3. In our case we obtained a value of 17% of free double bond relative to the total double bond content in the sample (it is assumed, that every signal count for a single 1H). Moreover, it is possible to determine the diene amount in the polymer, ~ 0.02%, which is determined by comparing the integral signal of the diene at 4.7 ppm with the signals of the ethylene and propylene and applying the formula described in the “Determination of copolymer compositions by benchtop NMR”.
From these results we can conclude that, with the help of a diffusion filter, it is possible on a Benchtop NMR to identify the signal of double bonds from the EPDM and free diene. Once the signals have been assigned the free diene content can be determined by simple integration.
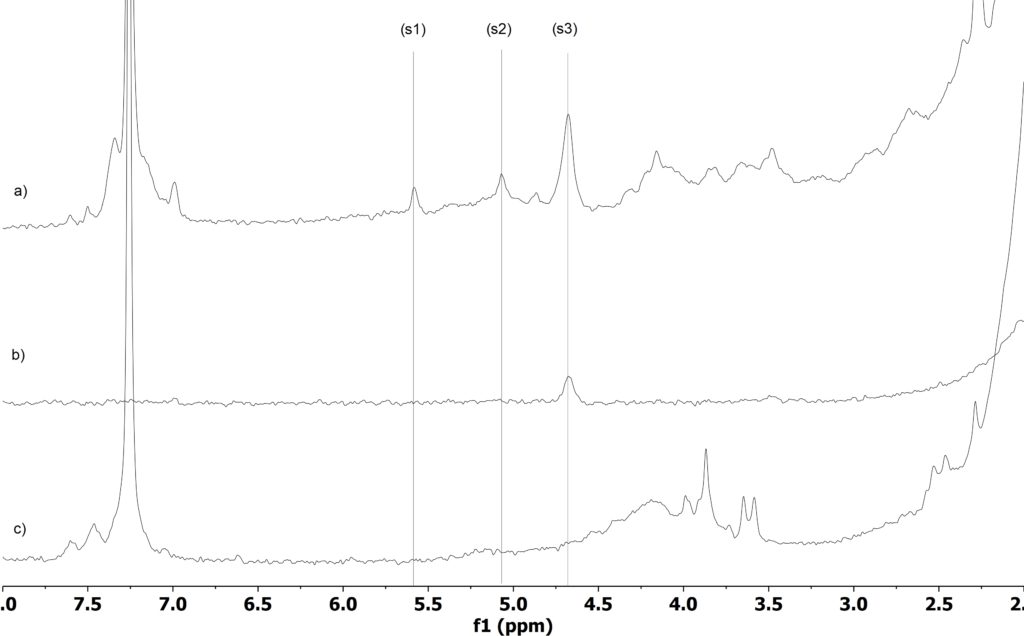
Figure 2: Stack plot of 1D 1H of EPDM before (a), spectrum acquired using a diffusion filter that completely attenuate the signals of fast diffusion molecules (b) and after reaction with IBr. The vertical lines highlight the allyl signals in the spectra (a).
Silicon NMR is a powerful analytical method used to characterize various types of materials. The NMR-active isotope is 29Si and silicon signals of different chemical groups spread over a wide chemical shift range. In this case study we utilize the high sensitivity of silicon to the surrounding atoms to confirm the composition of polysiloxanes.
The large chemical shift dispersion of 29Si is illustrated in Fig. 1, where we show the 29Si DEPT spectra of trimethoxymethylsilane (top), trimethoxyphenylsilane (middle) and dimethoxydimethylsilane (bottom) measured on a Spinsolve 80 MHz Silicon spectrometer. Each of these molecules has a unique chemical shift and can be easily differentiated from each other.

Figure 1: 29Si-DEPT spectra of trimethoxymethylsilane (top), trimethoxyphenylsilane (middle) and dimethoxydimethylsilane
Figure 2 shows the 29Si DEPT spectrum of poly(dimethylsiloxane-co-methylhydrosiloxane), trimethylsilyl terminated, measured on a Spinsolve 80 MHz Silicon spectrometer and the excellent agreement of the single building blocks to the predicted chemical shifts.

Figure 2: 29Si-DEPT spectrum of poly(dimethylsiloxane-co-methylhydrosiloxane) (CAS 68037-59-2, M = 950 g/mol) and the assignment of the NMR signals.
Click here to find out more by downloading and reading the full case study.
Molecular weight determination of silicone oils via 29Si on Spinsolve NMR systems
In both academic polymer research and industrial polymer production, it is crucial to regulate the molecular weight of polymers. This necessity arises from the fact that the macroscopic properties of polymers are predominantly dictated by their molecular structure and chain length. Therefore, understanding the molecular weight itself becomes imperative. While size-exclusion chromatography (SEC) is frequently employed as the prevailing standard, Nuclear Magnetic Resonance (NMR) serves as a valuable complementary method. NMR not only furnishes information on the molecular weight but also facilitates a comprehensive structural elucidation of polymer samples.

Figure 1: General molecular structure of dimethylpolysiloxane.
In the present study, we examined two trimethyl-terminated dimethylpolysiloxane-type silicone oils with distinct viscosities (10 and 100 cs, respectively), corresponding to different molecular weights. Although the 1D 1H spectra of the samples appear nearly identical, and the end groups cannot be differentiated from the signals of the polymer backbone, molecular weight determination through end-group analysis is straightforward using 29Si NMR.

Figure 2: 1D 29Si spectra measured on a Spinsolve 80 MHz Multi-X Ultra system, a) silicon oil with 10 cs, b) silicon oil with 100 cs viscosity.
Figure 2 displays the 1D 29Si spectra of a) the 10 cs and b) the 100 cs silicone oil measured on a Spinsolve 80 MHz Multi-X Ultra system. Both samples were prepared in a 1:1 dilution with CDCl3 doped with Cr(acac)3 and spectra were acquired with 4096 scans. Two regions were integrated—one for the end groups at around 6.7 ppm and the polymer backbone at around -22 ppm.
To calculate the molecular weight of both samples, we referred to the following formula, where DP represents the degree of polymerization, and Mru is the molecular weight of the repeating unit:

Here, DP is calculated with the next formular, where N is the number of Si atoms of the respective integral and Int is the corresponding absolute integral of the signal:

With a value of 74 g/mol for the repeating unit we determined the respective Mn information with 963 g/mol for the 10cs sample (Figure 2 a) and 5975 g/mol for the 100cs sample (Figure 2 b), respectively.
Further reading
Publications:
Stephen T. Knox, Sam Parkinson , Raphael Stone and Nicholas J. Warren, Polymer Chemistry, (2019)
Maarten Rubens, Joren Van Herck and Tanja Junkers, ACS Macro Letters, (2019)
Lignin analysis with benchtop NMR spectroscopy
Jerk Rönnols, Ernesto Danieli, Hélène Freichels and Fredrik Aldaeus, Holzforschung, (2019)
Johannes Höpfner, Karl-Friedrich Ratzsch, Carlo Botha and Manfred Wilhelm, Macromolecular Rapid Communications, (2018)
Carlo Botha, Johannes Höpfner, Britta Mayerhöfer and Manfred Wilhelm, Polymer Chemistry, (2019)
Dynamics of ionic liquids in poly(vinyl alcohol) porous scaffold. Low field NMR study
Carlos Mattea, Bulat Gizatullin, Siegfried Stapf, Magnetic Resonance Imaging, (2018)
Compact low-field NMR spectroscopy and chemometrics: A tool box for quality control of raw rubber
Kawarpal Singh, Bernhard Blümich, Polymer, (2018)
Download Resources
- Blog Post Distinguishing copolymers and polymer blends by Diffusion Ordered SpectroscopY (DOSY)
- Blog Post Determination of copolymer composition by benchtop NMR
- Blog Post Determination of the molecular weight of polymers by end-group analysis
- Blog Post Spinsolve used to follow on-line RAFT and free radical polymerisations in batch and continuous reactors
- App Note Determining weight percent oxyethylene in Pluronic F127