In part 5 we introduced the PGSE experiment to measure self-diffusion coefficients. We saw that if the peak integrals are displayed as a Stejskal-Tanner plot we can immediately identify if there is a single self-diffusion coefficient or not. This works pretty well for neat liquids, or solutions with a single type of molecule, or even polymer molecules with a size distribution. However, in real life we are often dealing with mixtures of molecules, and it would be nice if we could somehow separate the spectra of the individual compounds.
Consider for example the spectrum of a mixture of procaine and paracetamol in D2O. This is shown in the middle scan of Figure 1, along with the spectra of the pure compounds above and below. If we had only the mixture available, but not the pure compounds, it would be hard to figure out how many and which compounds are present in the mixture.
These spectra, along with all the others shown in this post, were acquired on a Spinsolve benchtop NMR spectrometer with additional hardware to enable PFGs for measuring diffusion.
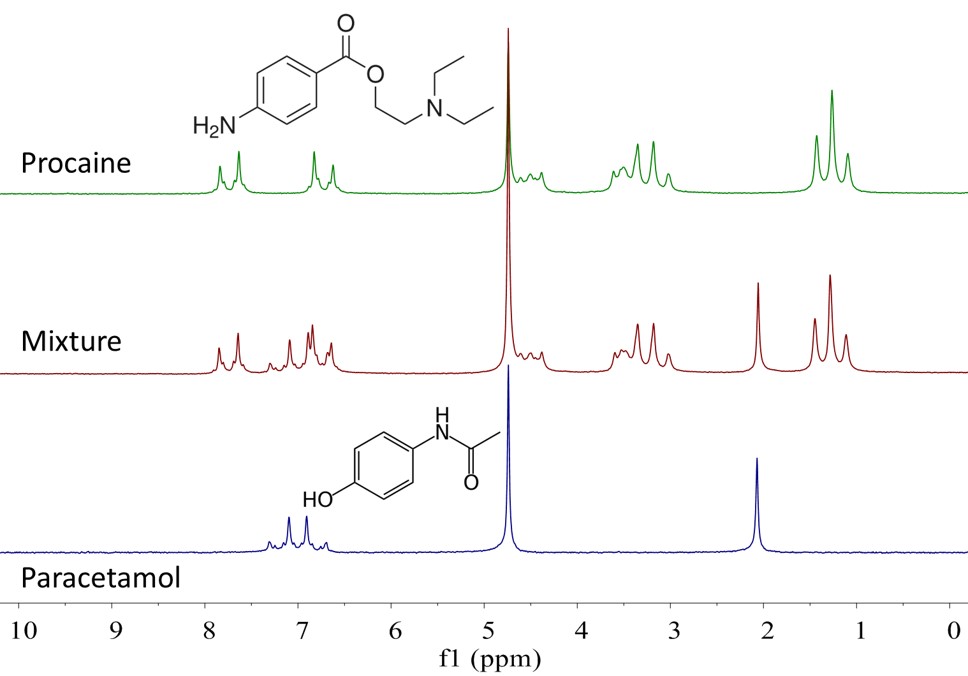
Figure 1: Spectra of procaine (top), paracetamol (bottom), and a 1:1 mixture of both (middle) in D2O.
In this case, there are some peaks in the spectrum of the mixture which are well resolved and belong to a single component. For example, the singlet at 2.07 ppm is the methyl peak of paracetamol, whilst the triplet at 1.26 ppm is the methyl peak of procaine. This suggests that we could run a PGSE experiment on the mixture and use the integrals of these two peaks to measure the self-diffusion coefficient of both compounds.
The stacked spectra of a PGSE experiment run on the paracetamol/procaine sample is shown in Figure 2 (a). If we look closely, we see that the solvent peak (shaded in blue) at 4.7 ppm decreases much faster with increasing gradient amplitude than the analyte peaks (shaded red and green). The normalised integrals of these three peaks are plotted in Figure 2 (b). We can see that there is a significant difference in self-diffusion coefficient between solvent and the two different types of molecules in the mixture.
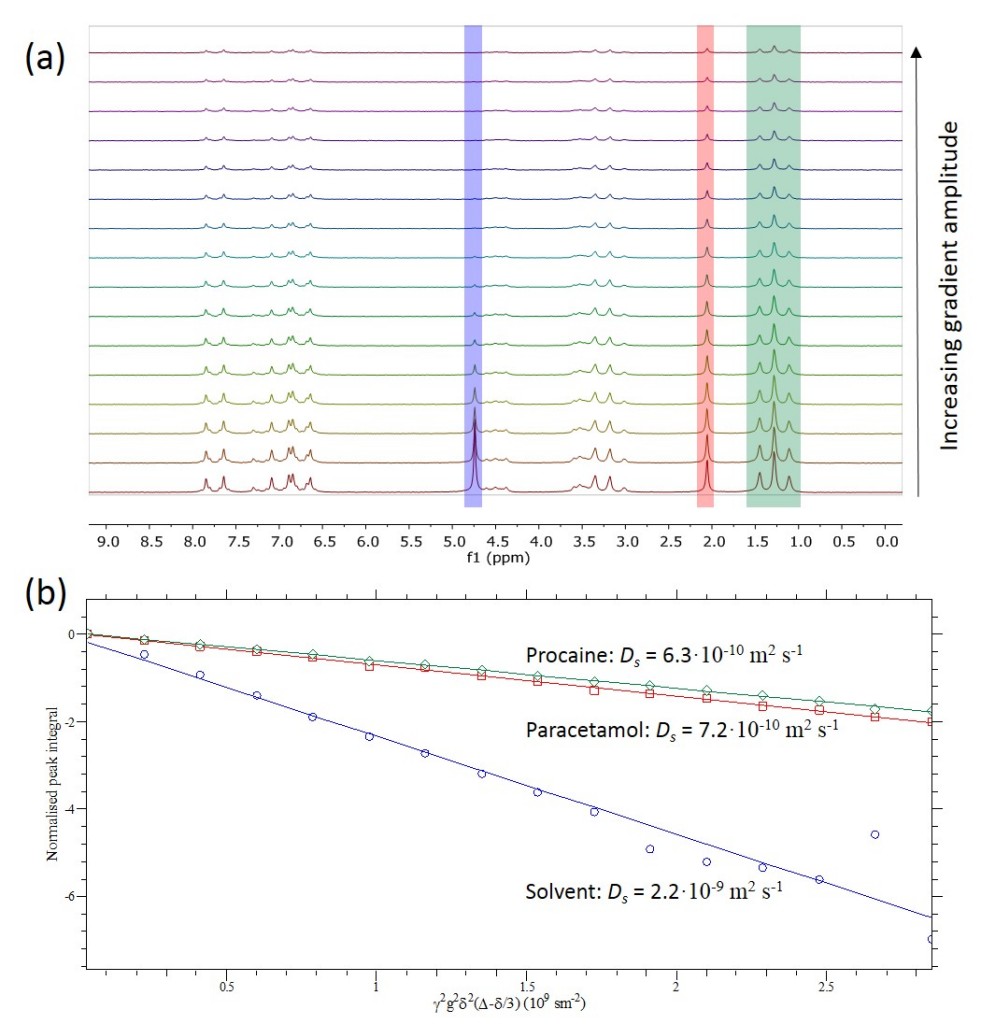
Figure 2: (a) A stacked plot of measured spectra of the paracetamol/procaine mixture. (b) Stejskal-Tanner plots of the solvent peak (blue), and the methyl peaks of paracetamol (red) and procaine (green).
The analysis so far has been done manually and requires some initial knowledge about the peaks. Wouldn’t it be nice to have a way to analyse a diffusion experiment automatically so that we can immediately see which peak belongs to which diffusion coefficient, or even separate the spectra of the components?
Such an analysis is indeed possible. It is called Diffusion Ordered Spectroscopy (DOSY) and creates a two-dimensional plot similar to a two-dimensional spectrum. The chemical shift is measured along the horizontal axis, and along the vertical axis we show the self-diffusion coefficient. There are tools around which can perform this analysis, and one of them is the DOSY Toolbox. Using this toolbox, I have inverted the data set shown in Figure 2 (a) to create a DOSY spectrum. This is shown in Figure 3.
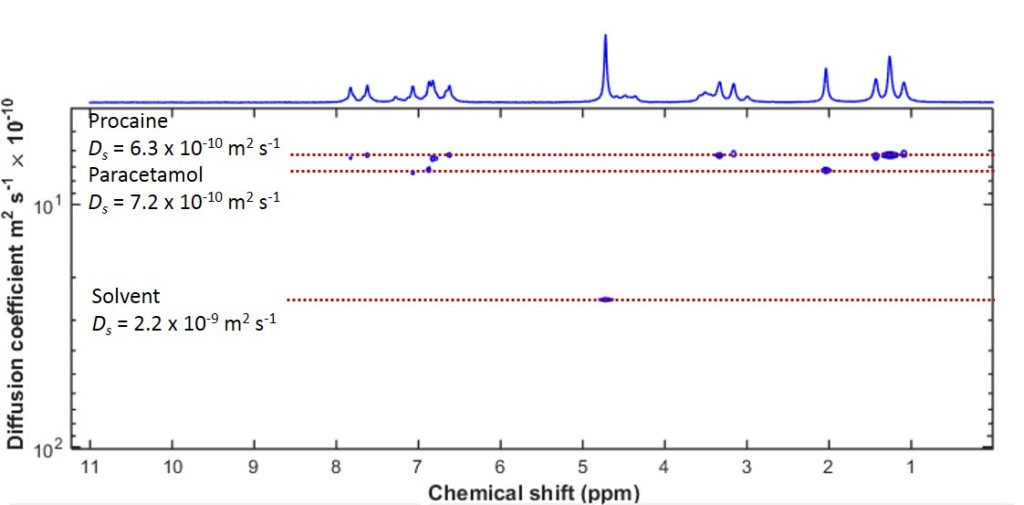
Figure 3: A DOSY spectrum of a mixture of paracetamol and procaine in D2O. The 2D peaks align themselves along horizontal lines, corresponding to the same component in the mixture.
What is obvious from this 2D spectrum is that the peaks are aligned along horizontal lines. Each of these lines corresponds to a different self-diffusion coefficient, and therefore a different component of the mixture. We can immediately separate the solvent peak, as well as the other two components, although their diffusion coefficients differ by a little more than 10%. This makes DOSY a very powerful tool for mixture analysis by NMR when the components have different diffusion coefficients.
As the DOSY experiment separates the components of a mixture via their molecular mobility similar to chromatography, this type of technique is sometimes also known as NMR chromatography. The advantage of the DOSY method for mixture analysis is that it does not require all the sample preparation, solvents and columns required for conventional chromatography.
The Spinsolve benchtop NMR spectrometer can now be purchased with additional hardware to enable PFGs for measuring diffusion. If you have any questions or want to discuss how gradients or other NMR methods can help with your application please Contact Us.