Batteries
NMR spectroscopy provides direct molecular‑level insights into ion coordination, speciation, solvent interactions, degradation pathways, and transport phenomena. You can use your Spinsolve for quantifying electrolyte composition, tracking aging processes, and probing lithium-ion mobility under different conditions to check the battery performance, safety, and longevity.
Bringing NMR to the Battery Lab
Practical Electrolyte Analysis with Benchtop NMR Systems
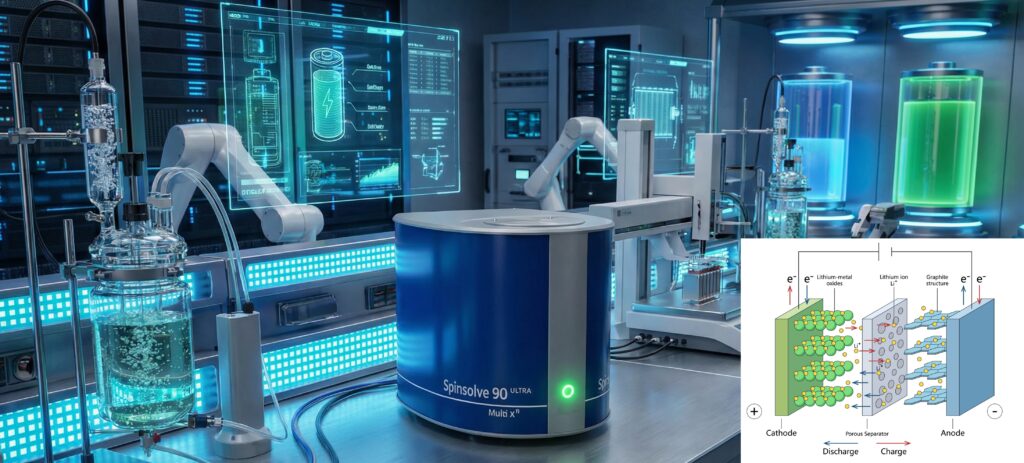
Lithium-ion batteries (LIBs) have become indispensable in modern portable electronics and are now central to the rapid expansion of electric mobility and advanced energy storage systems. Their performance, safety, and longevity depend strongly on the chemical composition and stability of the liquid electrolyte, which typically consists of a lithium salt such as LiPF₆ dissolved in mixtures of organic carbonates. Serving as the charge-transport medium between electrodes, the electrolyte governs key battery characteristics including ion mobility, rate capability, and overall energy release [1]. Understanding and monitoring electrolyte properties is therefore essential in fields ranging from fundamental materials research to industrial production and quality control.
Nuclear magnetic resonance (NMR) spectroscopy has emerged as one of the most informative analytical techniques for studying LIB electrolytes. It provides direct molecular-level insights into ion coordination, speciation, solvent interactions, degradation pathways, and transport phenomena. Numerous studies have demonstrated the value of NMR for quantifying electrolyte composition, tracking aging processes, and probing lithium-ion mobility under different conditions.
Modern Spinsolve benchtop NMR spectrometers make advanced NMR capabilities accessible in the laboratory environment with an unmatched simplicity & cost. It offers high-quality relevant data in a compact, cryogen-free platform. The system is engineered for simplicity and robustness, enabling reliable measurements directly at the point of use. Neat electrolyte samples can be analyzed without dilution or deuterated solvents, thanks to the integrated hardware lock. Based on a go-without-saying robustness, Spinsolve also provides fully quantitative results with the use of a unique (per nucleus) internal or external standard saving cumbersome calibration time & standard cost. Spinsolve supports automatic nucleus switching among key nuclei: ¹H, ⁷Li, ¹¹B, ¹³C, ¹⁹F, ²³Na, and ³¹P, eliminating manual tuning and matching steps.
With a single unit, Spinsolve combines identification, quantitative & mobility results on solvents, additives, conducting salts and their degradation products. Spinsolve consolidates workflows that traditionally require multiple analytical techniques. Its speed, operational ease, and minimal maintenance demands make it an attractive platform for routine battery research, production control, and diagnostic applications.
In this Application Note, we highlight how Spinsolve can be used to rapidly and effectively characterize lithium-ion battery electrolytes, demonstrating its value as a versatile tool for both research laboratories and industrial environments.
Solvent composition analysis
LIB electrolytes usually consist of ethylene carbonate (EC) and other carbonate solvents. EC with high dielectric constant facilitates disassociation of (most often LiPF6) salts to give free ions. It is also involved in the formation of the solid electrolyte interface (SEI) to protect the anode. But the viscous nature of EC requires blending with other carbonate solvents, commonly diethylene carbonate (DEC), imethylcarbonate (DMC), ethylmethyl carbonate (EMC), or propylene carbonate (PC) to increase the ion mobility and enhance temperature erformance. The composition of solvents needs to be carefully tailored for a good balance and accurately controlled to ensure optimum erformance. Figure 1 shows a single scan 1H spectrum of a mixture of DMC, DEC and EC. The signals of all three solvents can be baseline-resolved. The characteristic chemical shifts and splitting pattern allows one to analyze solvent composition of any unknown electrolytes. Based on the integrals, the ratio of each solvent can be easily calculated with high precision (RSD<0.1 %) and is in excellent agreement with gravimetric results. The spectrum was recorded in 7 seconds without any sample preparation prior to NMR measurement, offering a convenient way for solvent composition analysis compared to high performance liquid chromatography (HPLC) or gas chromatography (GC).
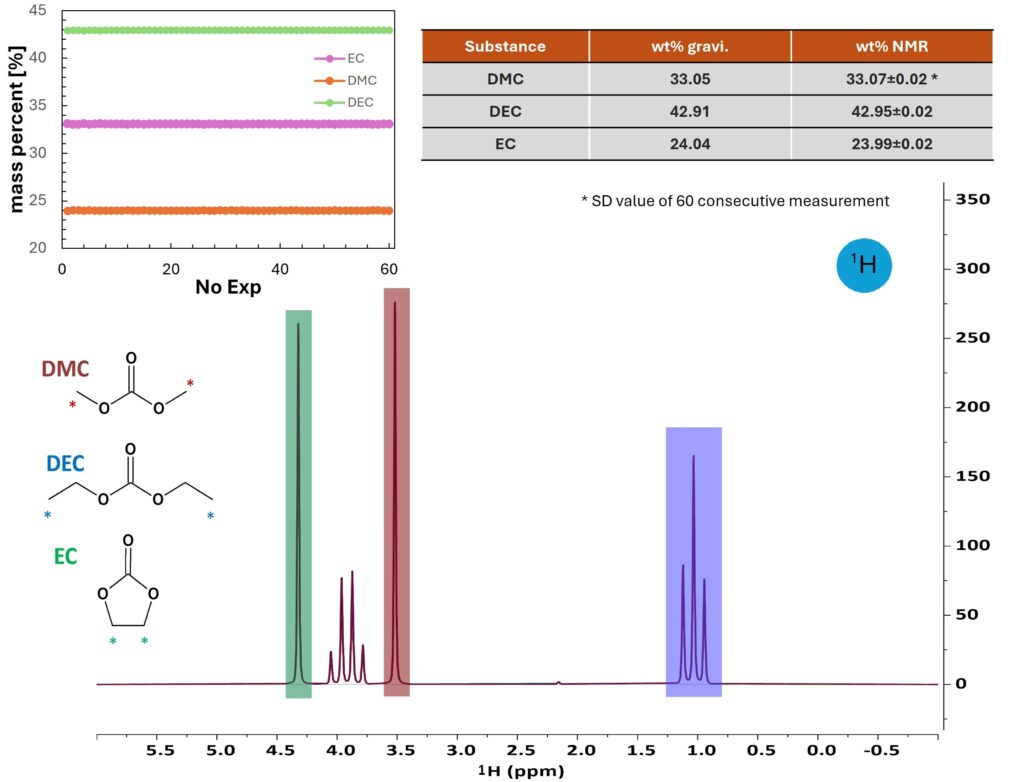
Figure 1. Quantification of EC, DMC, and DEC in a ternary electrolyte mixture by ¹H NMR. The comparison against gravimetric quantification shows excellent agreement (table top right). The top left plot shows an overlay of 60 spectra measured to assess the repeatability of the NMR analysis. The relative standard deviation of the 60 measurements is less than 0.1% for all three components.
Fast detection and quantification of additives
The high sensitivity of 1H NMR also allows detecting and quantifying lower concentration of additives, such as vinylene carbonate (VC) as a common additive in electrolytes to prolong battery lifetime. To highlight the linearity and repeatability of the Spinsolve system, a series of DMC/DEC/EC electrolytes with 0-3 % of VC were measured. VC contributes to a characteristic singlet at 7.2 ppm. The Spinsolve spectrometer
has a fixed response factor for individual nuclei, the signal integral is independent of parameter settings and is directly proportional to molar concentration—not only for components within the same mixture, but also for samples measured in separate tubes. Figure 2 shows a series of electrolytes spiked with various amounts of VC. The integral of the VC signal shows an excellent linear correlation with the VC content. Because of the high sensitivity, a one-minute ¹H NMR measurement delivered quantification results with high repeatability for an electrolyte containing 1 % VC (1.000 ± 0.0025 %, based on 10 consecutive measurements). A recent study [2] reported quantification of 1-5 % VC in electrolytes by Spinsolve NMR spectrometer to investigate the amount of VC involved in SEI formation. Other widely used additives, like ethylene sulfate (DTD), 1,3,6-hexanetricarbonitrile (HTN), and fluoroethylene carbonate (FEC) can likewise be identified and quantified by using ¹H NMR spectroscopy, as shown in 1H spectra of some other complex electrolytes in Figure 3.
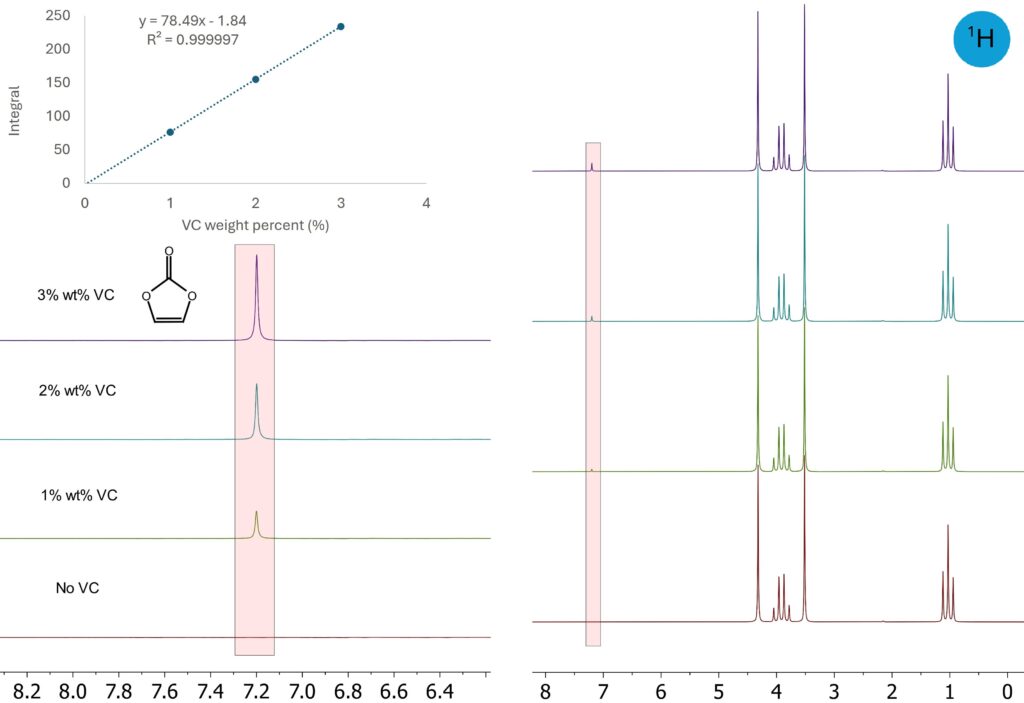
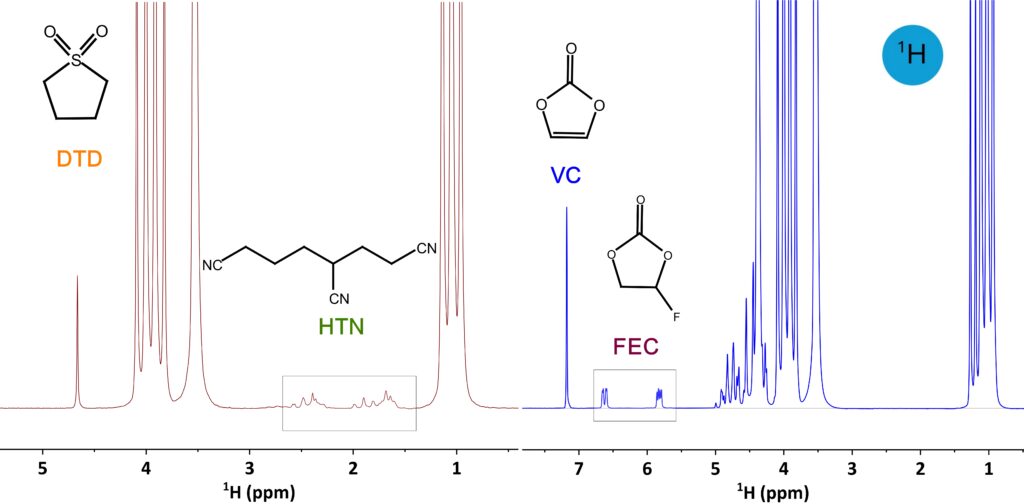
Figure 3. 1H spectra of artificial electrolyte (in red) containing DTD and HTN in EMC and electrolyte (in blue) containing VC and FEC in EC and EMC.
Quantification of conducting salts
Quantitative analysis using techniques such as HPLC, GC, or high-field NMR typically requires frequent calibration with reference standards. On a Spinsolve spectrometer, the response factor for each nucleus is determined by the factory hardware settings and remains highly stable over time due to the exceptional stability of the magnet and electronics. As a result, repeated calibration is generally unnecessary. In addition, the response factor is minimally affected by sample properties, as evidenced by the excellent linearity of Li⁺ over a wide dynamic range shown in Figure 4.
As the initial step, a single-point calibration using an external standard is sufficient to determine the response factor, which can be used to calculate the concentration of unknown samples based on the integral. In this example, the Li⁺ response factor was first established with a solution of lithium chloride (0.5 M in water). The Li⁺ concentration in the same electrolytes with and without aging treatment were easily derived from the integrals. The lower Li⁺ concentration in aged electrolyte can be attributed to lithium salt precipitation.
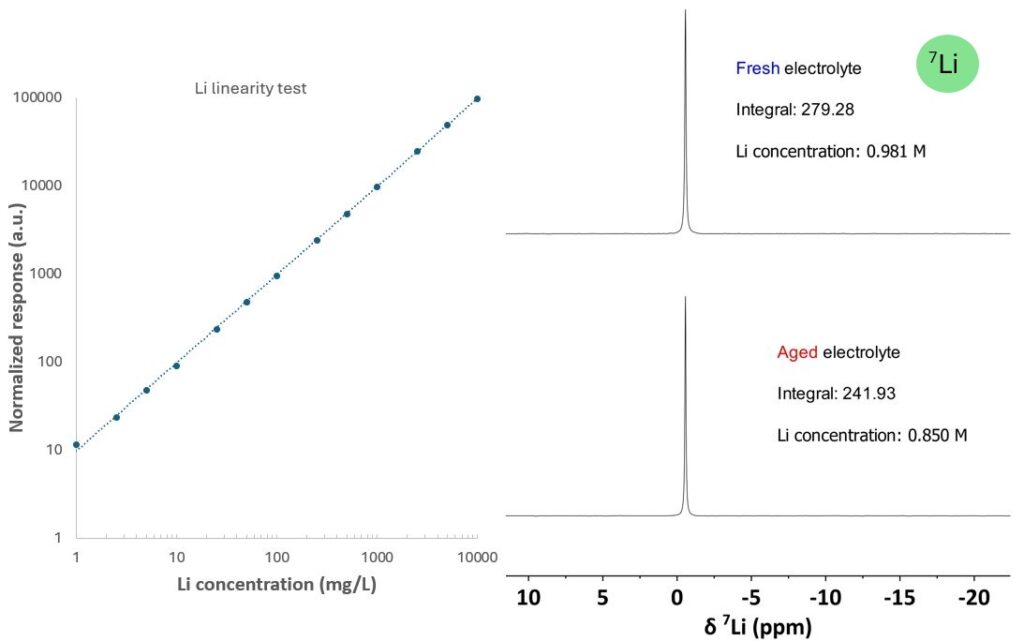
Figure 4. Regression curve of LiCl at different concentrations and Li+ quantification of electrolytes using a single-point calibration.
This quantification approach can be used not only to quantify the Li⁺ cation concentration but also the anion concentration. This is particularly important for multi-salt electrolytes designed to enhance the electrochemical and thermal stability of advanced batteries [3]. Because the anions in these systems typically contain fluorine, ¹⁹F NMR spectroscopy is especially powerful due to its high sensitivity and broad chemical-shift dispersion. This wide dispersion allows ¹⁹F NMR to resolve multiple fluorine-containing species within the same spectrum, making it well suited for characterizing complex multi-salt electrolyte formulations. Note that the signals are about 200 ppm apart, uniform excitation of all signals on high-field NMR can be difficult, even if the transmitter frequency is carefully chosen at the center. The Spinsolve Multi X switching technology combined with the efficient probe design enables a uniform excitation profile over a large chemical shift range enabling accurate quantification of signals that are even more than 200 ppm apart from each other without the need of correction or additional measurements. Figure 5 shows the ¹⁹F spectrum of an artificial electrolyte where all three lithium-conducting salts are clearly resolved in a distinct chemical-shift region, along with their corresponding hydrolysis products. As only a single response factor is required for quantification, the integral values of the different anions can be directly converted into molar concentrations that can be further converted in mass concentration once the structures are identified.
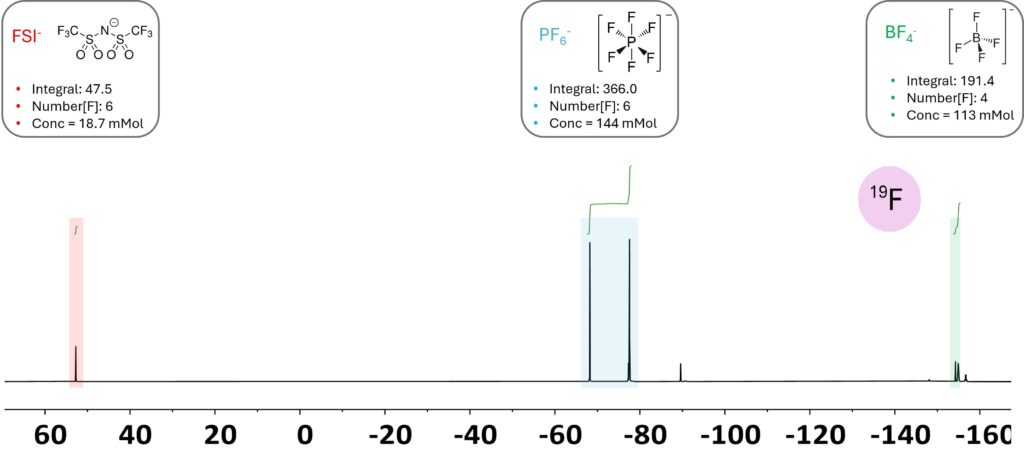
Figure 5. 19F spectrum of a multi-salt electrolyte showing signals from conducting salts (marked regions) and their related hydrolysis products (minor signals outside of marked regions).
Hydrofluoric acid (HF) quantification
Quantifying HF in electrolytes is essential because a small amount of HF can form through oxidation processes and severely affect the chemical stability, safety, and performance of electrochemical systems. HF is highly reactive and corrosive, and it can degrade electrode materials, damage protective surface layers, and trigger unwanted side reactions. This leads to accelerated aging, reduced efficiency, and potential safety risks. By monitoring HF levels as part of routine quality control, manufacturers ensure material integrity, consistent product performance, and long-term reliability.
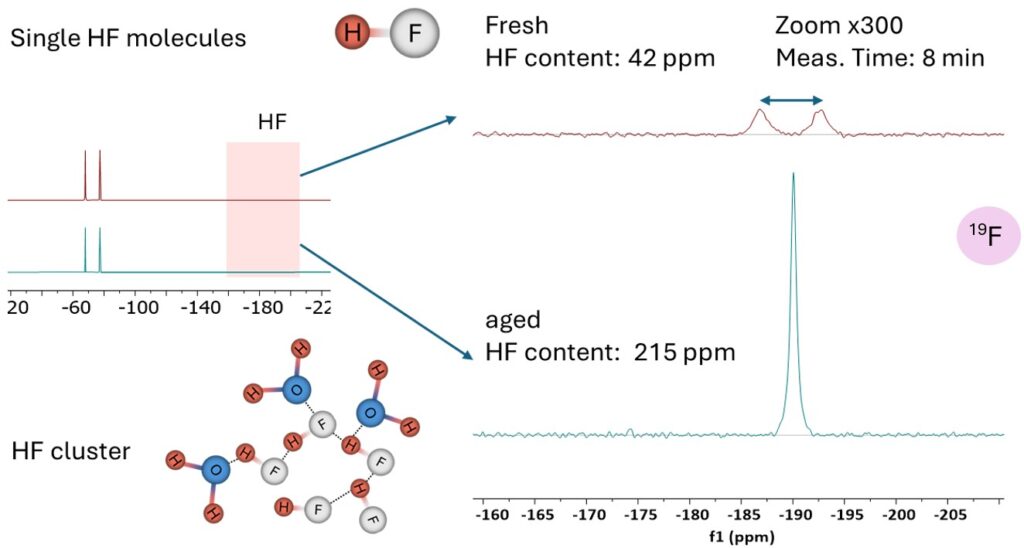
Figure 6. HF quantification in fresh and aged electrolytes by 19F measurement. The signal of HF appears as a doublet in a fresh electrolyte because of 1H-19F coupling but collapses to a broad singlet due to exchange at higher water content.
Figure 6 shows 19F spectra of a commercial electrolyte, a doublet at -74.3 ppm from PF6 anion dominates the spectrum. After more scans, however, the signal of HF gets also resolved at 190.1 ppm. In a fresh electrolyte, the HF signal appears as a doublet because HF remains intact at very low water content, and the coupling to the bonded proton causes splitting of the fluorine signal. In the presence of larger water content, the doublet collapses into a singlet because HF undergoes rapid proton exchange with water and related species, averaging out the 19F–1H coupling. Based on its integral, the HF content in the fresh electrolyte was calculated to be 40.2 ppm. The signal-to-noise ratio (SNR) of the HF signal is 12, defining a limit of detection (LOD – concentration for SNR=3), of 10 ppm for a 8 minutes measurement. Considering that the SNR of the NMR spectrum is proportional to the square root of measurement time, the LOD can be further reduced by increasing the measurement time.
Investigation of electrolyte degradation
Detecting and quantifying HF and other hydrolysis products formed from the reaction between the conducting salt and moisture in air or residual water in the electrolyte is important for understanding electrolyte aging. Figure 7 shows a 19F spectrum of an aged electrolyte acquired in a single-scan (5 seconds). In the spectrum we can clearly identify the PF6– anion and its related hydrolysis products. Signals were assigned following previous study [4,5].
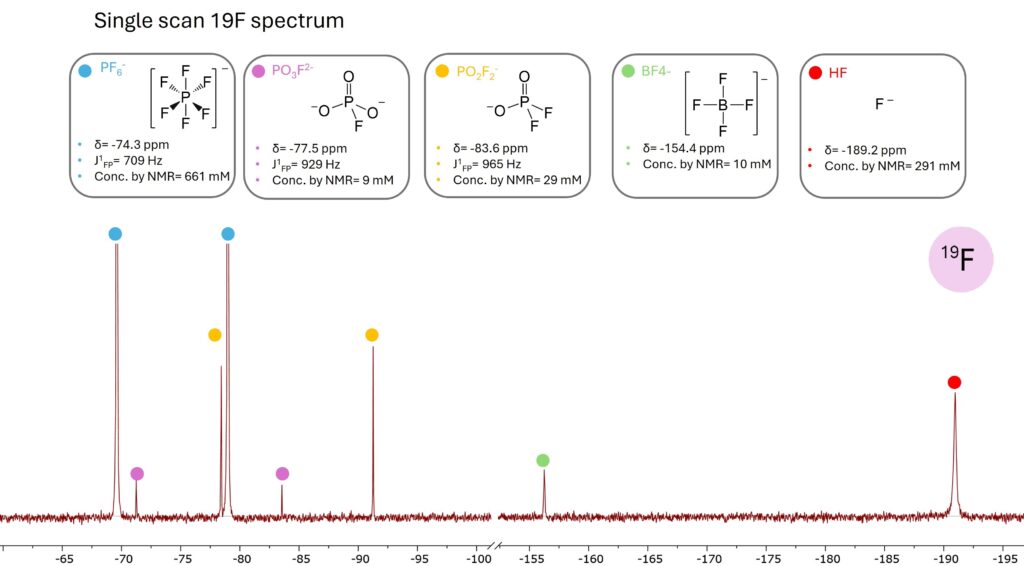
Figure 7. 19F spectrum of an aged electrolyte acquired in just 5 seconds. In this short measurement time different LiPF6 hydrolysis products were detected.
An accelerated PF6 degradation study was conducted by adding two microliters of water into 0.5 mL of a standard LiPF6 electrolyte. Figure 8 shows the concentration as a function of time of the different hydrolysis products. The monitoring experiment acquired 19F spectra during 20 hours. Based on the proposed degradation pathway [5], if water is abundant, PF6 is hydrolyzed rapidly to OPF2O– and strongly increases HF concentration. OPF2O– further reacts to water to generate a more stable OPFO22- and releases more HF. HF attacks the borosilicate glass tube used to contain the sample to yield BF4– and water. The reaction between PF6-derived related species (such as OPF2O-) and solvent molecules like DMC is chemically feasible, the resulting products typically only reach detectable levels after an extended aging period due to the extremely slow reaction rate [5] .
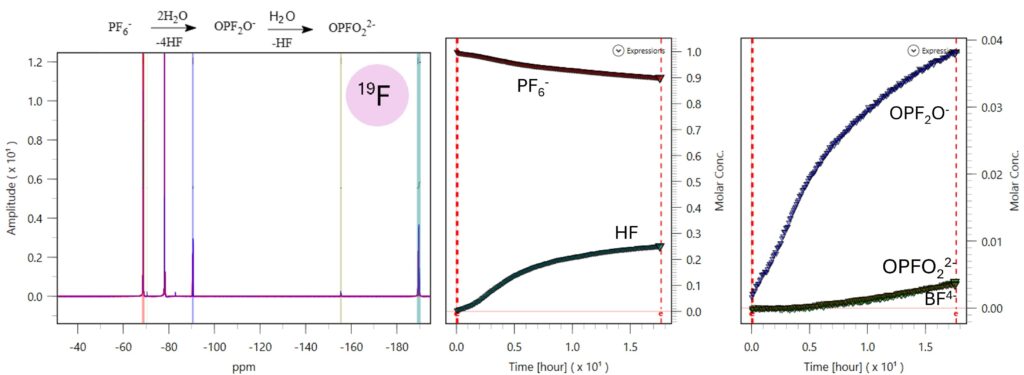
Figure 8. Accelerated hydrolysis of electrolytes monitored by 19F NMR.
Characterization of PVDF
Polyvinylidene fluoride (PVDF) based electrolytes are of great potential for the development of solid-state batteries [7]. It functions also as separator component in LIB [8] and as binder for electrode materials [9]. The 19F spectrum of PVDF provides valuable structural information. The highest signal between -90 and 95 ppm corresponds to the head-to-tail connection, while the head-to-head connection form is also visible between -100 and -120 ppm [10]. The ratio between the two forms can be simply calculated as the ratio of the respective signal integrals. As the different 19F signals are excited uniformly, no complex correction is required, as explained above. The fact that the ratio of the signals at around -72 ppm (CF3 group) and -180 ppm (CF group) is exactly 3:1, suggests the presence of branching structures from the hexafluoropropylene (HFP) monomer. The signals of the HFP-CF2 group, which should exhibit an integral of 2, overlap with the VF2-CF2 signals from -90 to -120 ppm. By subtracting the HFP-CF2 integral, the integral of VF2-CF2 can be calculated as 7.5. Then the monomer ratio between VF2 and HFP is 3.755:1. Combining the monomer ratio and the fluorine content of each monomer (VF2: 59.3%; HFP: 76.0%), the total fluorine content of the PVDF polymer can be also calculated as 65.7%.
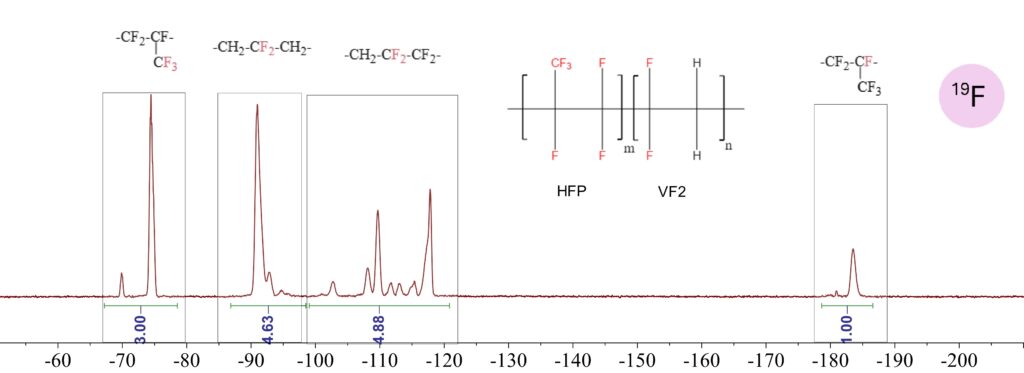
Figure 9. 19F NMR spectrum of PVDF-HFP copolymer in DMF. Spectral assignments: -65 to -75 ppm (HFP-CF3 groups); -90 to 95 ppm (VDF-CF2 head-to-tail connection); -100 to -120 ppm (HFP-CF2 groups overlapped with VDF-CF2 head-to-head connection); and -175 to -185 ppm (HFP-CF groups).
Ion mobility and other performance indicators of electrolytes
Spinsolve NMR spectrometers can be equipped with pulsed field gradient (PFG) capabilities to enable the measurement of molecular self-diffusion coefficients. The diffusion coefficients derived from PFG NMR can be related to ion mobility, ion-ion interaction, solvation effect, and ultimately to battery performance. Figure 10 summarizes the diffusion measurements of all three nuclei in a LiPF6 electrolyte (1M LiPF6 in EC/DMC 1:1, v/v). As expected from 19F and 31P measurements, a similar diffusion value is obtained because they diffuse together. Surprisingly, lithium ions diffuse slower than the anions although the size is smaller. This is due to the large charge density of Li+, which attracts solvent molecules to form a big complex [11].
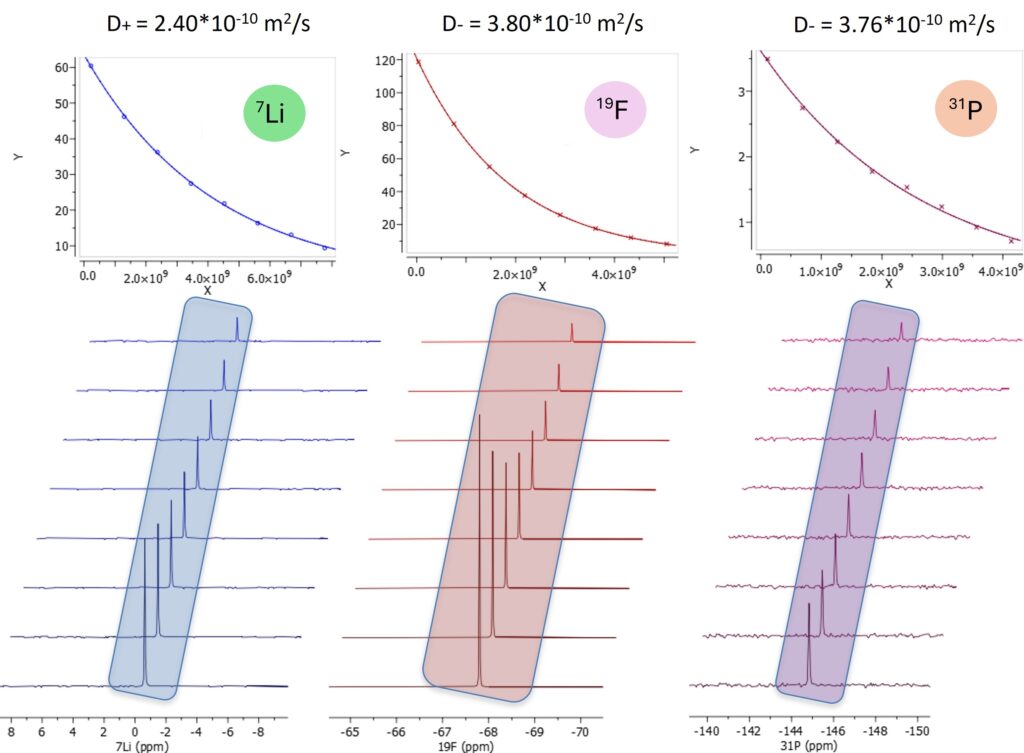
Figure 10. Diffusion NMR measurement of cation and anion in electrolyte.
In addition, key performance indicators of the ion transport property such as transference number and ion conductivity can be derived from diffusion values based on the Nernst–Einstein equation [12]. Table 1 summarizes the results for three groups of electrolytes consisting of 1 M LiPF6 in different solvent systems. The transference numbers, t+ and t-, show little dependence on solvent composition and ratio. EC/DMC electrolytes show higher conductivity than EC/DEC, while the conductivity of the EC/DEC/DMC electrolyte falls between the two. Between the two EC/DMC electrolytes, a higher proportion of DMC apparently further increases the ion conductivity. It has been noted that Nernst–Einstein equation overestimates the ion conductivity [12,13]. As shown in Table 1, the conductivity calculated from NMR diffusion measurements (σNMR) is higher than the value reported by the supplier (σreal, https://solvionic.com/en/6-electrolytes). This discrepancy appears because the Nernst–Einstein equation assumes an ideal model where lithium salts are fully disassociated and all ions diffuse independently, which, in reality, is rarely the case. For example, ion interactions lead to ion pairs and ion clusters, especially at such high salt concentrations, effectively reducing the number of charge carriers. Nevertheless, the σNMR/σreal ratio remains approximately constant at about 2 for the three electrolytes, indicating that the conductivity results obtained by NMR could be a reliable comparative performance indicator. The σNRM / σreal ratio is linked often to the degree of ion association [14]. A lower σNMR / σreal ratio reflects a smaller extent of ion pairing or aggregation and weaker ion-ion or ion-solvent interactions, corresponding to a larger fraction of free ions actively contributing to charge transport. Therefore, this ratio can serve as quantitative parameter for evaluating dissociation and guiding electrolyte design.
Table 1. Summary of diffusion values and calculated performance indicators.
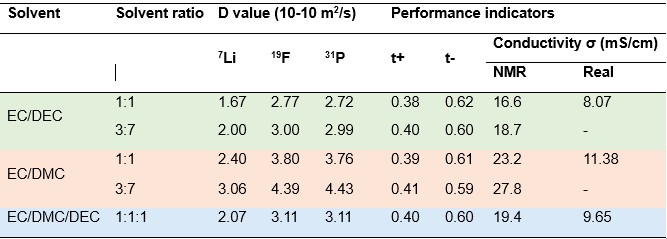
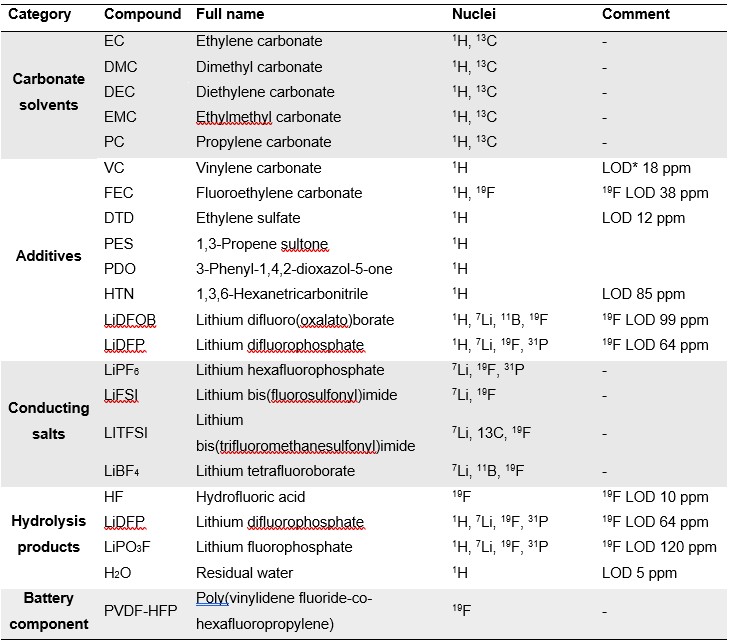
Table of Common Electrolyte Components Quantified with Spinsolve
References
[1] K. Xu, “Nonaqueous Liquid Electrolytes for Lithium‐Based Rechargeable Batteries,” ChemInform, vol. 35, no. 50, Dec. 2004, doi: 10.1002/chin.200450271.
[2] S. Azam, W. Black, H. MacLennan, A. Eldesoky, and J. R. Dahn, “Additive Screening of LFP/graphite Pouch Cells for High Temperature Cycling at 70 °C,” J. Electrochem. Soc., vol. 172, no. 2, p. 020536, 2025, doi: 10.1149/1945-7111/adb64d.
[3] J. Hu et al., “Rational design of multi-salt propylene carbonate-based electrolyte for enhanced long-lifespan and safety in pouch cells,” Chemical Engineering Journal, vol. 518, p. 164639, Aug. 2025, doi: 10.1016/j.cej.2025.164639.
[4] P. Barnes et al., “A non-aqueous sodium hexafluorophosphate-based electrolyte degradation study: Formation and mitigation of hydrofluoric acid,” J. Power Sources, vol. 447, p. 227363, 2020, doi: https://doi.org/10.1016/j.jpowsour.2019.227363.
[5] S. Wiemers-Meyer, M. Winter, and S. Nowak, “Mechanistic insights into lithium ion battery electrolyte degradation-a quantitative NMR study,” 2016, Royal Society of Chemistry. doi: 10.1039/c6cp05276b.
[6] J. Hu et al., “Rational design of multi-salt propylene carbonate-based electrolyte for enhanced long-lifespan and safety in pouch cells,” Chemical Engineering Journal, vol. 518, p. 164639, 2025, doi: https://doi.org/10.1016/j.cej.2025.164639.
[7] Y. Wu, Y. Li, Y. Wang, Q. Liu, Q. Chen, and M. Chen, “Advances and prospects of PVDF based polymer electrolytes,” Journal of Energy Chemistry, vol. 64, pp. 62–84, 2022, doi: https://doi.org/10.1016/j.jechem.2021.04.007.
[8] K. Bicy, A. B. Gueye, D. Rouxel, N. Kalarikkal, and S. Thomas, “Lithium-ion battery separators based on electrospun PVDF: A review,” Surfaces and Interfaces, vol. 31, p. 101977, 2022, doi: https://doi.org/10.1016/j.surfin.2022.101977.
[9] X. Zhong et al., “Binding mechanisms of PVDF in lithium ion batteries,” Appl. Surf. Sci., vol. 553, p. 149564, 2021, doi: https://doi.org/10.1016/j.apsusc.2021.149564.
[10] S. Banerjee, Y. Patil, O. Gimello, and B. Ameduri, “Well-defined multiblock poly (vinylidene fluoride) and block copolymers thereof: a missing piece of the architecture puzzle,” Chemical Communications, vol. 53, no. 79, pp. 10910–10913, 2017.
[11] Z. Cui et al., “Molecular anchoring of free solvents for high-voltage and high-safety lithium metal batteries,” Nat. Commun., vol. 15, no. 1, p. 2033, 2024.
[12] A. France-Lanord and J. C. Grossman, “Correlations from Ion Pairing and the Nernst-Einstein Equation,” Phys. Rev. Lett., vol. 122, no. 13, Apr. 2019, doi: 10.1103/PhysRevLett.122.136001.
[13] M. Chintapalli et al., “Relationship between Conductivity, Ion Diffusion, and Transference Number in Perfluoropolyether Electrolytes,” Macromolecules, vol. 49, no. 9, pp. 3508–3515, May 2016, doi: 10.1021/acs.macromol.6b00412.
Further Reading
Publications:
Chemically induced deceleration of nuclear spinrelaxation (CIDER) preserves hyperpolarization
Andrey Pravdivtsev, Josh Peters, Charbel Assaf, Arne Brahms, Kolja Them, Mirco Gerdsen, Rainer Herges, Jan-Bernd Hövener, ResearchSquare, (2024)