The global awareness for climate change and sustainability related topics is continuously increasing. A long-time problem in this area is related to ground water contamination, which is in the focus of industry and politics. It is known that organic solvents applied in a variety of industrial chemical processes, such as methanol (MeOH) or chloroform (CHCl3), are toxic for biological organisms. On this basis it is extremely important to analyze waste water streams to detect small concentrations of chemical compounds. Among many analytical methods available for determining the type and concentration of organic solvents in waste effluents, one is NMR spectroscopy. While conventional NMR equipment uses expensive superconductive magnets, benchtop NMR systems uses compact permanent magnets. The lower price and smaller size of this units have opened the opportunity to count with mobile equipment that can be installed in production plants for on-line analysis.

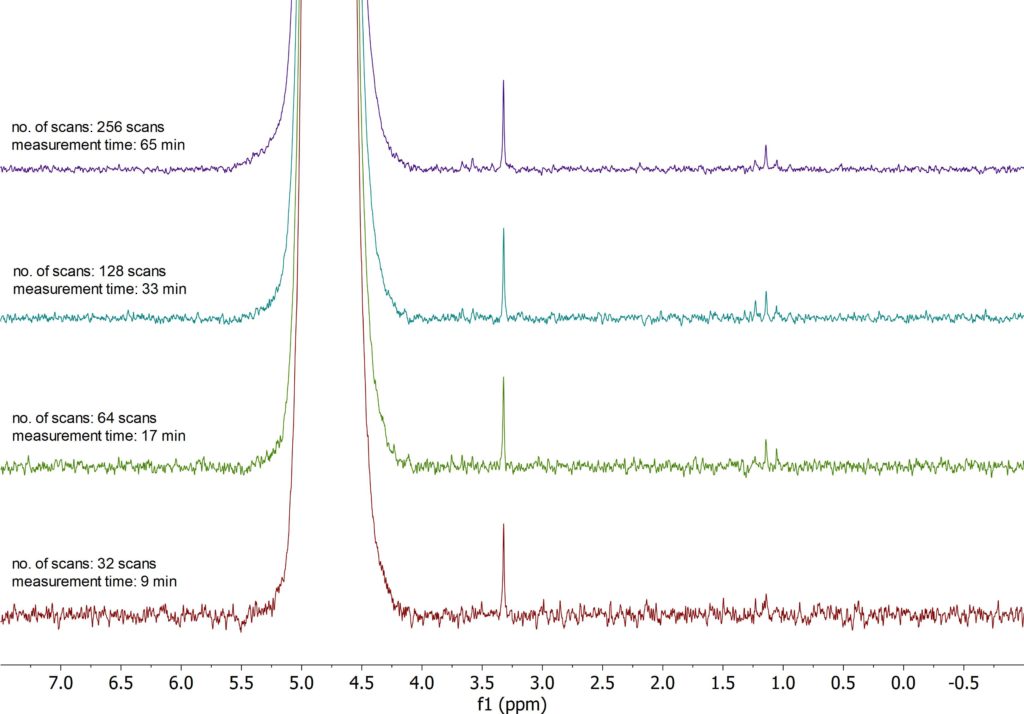
Figure 1: 1H NMR PRESAT stack plot of 10 ppm MeOH/EtOH in H2O
In order to evaluate the potential of this technology for trace analysis, we report in this post a study performed on samples containing low amounts of MeOH and EtOH in H2O . These samples were prepared from a stock solution and were set to concentrations of 100, 25 and 10 ppm weight basis of MeOH or EtOH in H2O . This is equivalent to molar concentrations of 3.1 mM for MeOH and 2.2 mM for EtOH (on 100 ppm), 0.78 mM for MeOH and 0.54 mM for EtOH (on 25 ppm) and 0.31 mM for MeOH and 0.22 mM for EtOH (on 10 ppm), respectively. The spectra of these samples have been collected on our new Spinsolve© 80 MHz Ultra system.
Figure 1 shows the 1H spectra measured for the 10 ppm sample as a function of the measurement time. The spectra were acquired using a solvent suppression sequence, to efficiently attenuate the water signal. As it can be seen, the triplet of EtOH can be well differentiated from the noise even for the spectrum obtained with 64 scans (a 17 min. measurement time). The MeOH single remains visible even with 32 scans.
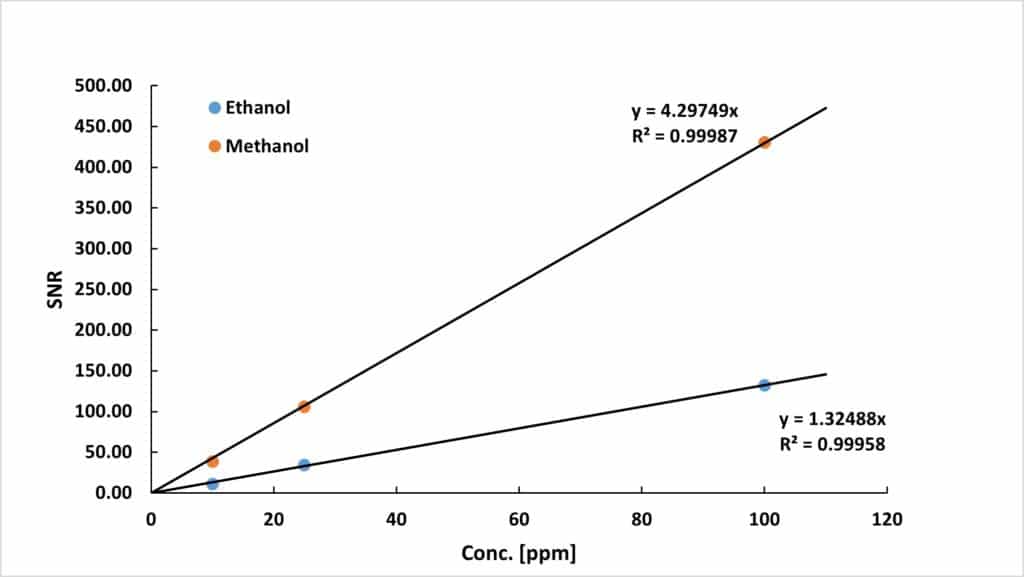
To mathematically determine the LOD the samples were measured using 128 scans, 3.2 s acquisition time, and 15 seconds repetition time (resulting in a total measurement time of 32.5 min). In addition, the spectra were corrected by applying manual phase correction, a 0.5 Hz Lorentzian broadening apodization, and a 1st order polynomial base-line correction. Under this conditions the LOD was calculated by linear extrapolation of the signal-to-noise ratio (SNR) to a value of 3 (see Figure 2). These parameters enabled us to reach LOD values of:

These results demonstrate the potential of our benchtop systems to detect sub-millimolar trace concentrations in H2O samples.

Figure 2: SNR of ethanol and methanol plotted as a function of the concentration. The limit of detection is calculated by extrapolating the SNR to a value of 3.