Deuterium NMR serves various chemical applications, enabling the tracing of reaction pathways and a deeper comprehension of their underlying mechanisms [1]. It also plays a crucial role in exploring biochemical to study metabolic pathways [2,3]. To achieve these goals, Deuterium labeling is employed to mark specific positions within molecules, significantly enhancing sensitivity. In one of our recent blog posts, we explored deuterated compounds and demonstrated that they can be easily and rapidly analyzed using benchtop NMR systems.
However, when it comes to measuring deuterium NMR on natural abundance samples, as is the case in techniques like SNIF-NMR [4] used for determining food authenticity, it presents a considerable challenge. Deuterium possesses a low gyromagnetic ratio and exists in very low natural abundance, approximately 0.015%, which results in a highly insensitive nucleus. For this reason, the prevailing perception is that the measurement of deuterium in natural abundance samples may not be a viable option for benchtop NMR spectrometers.
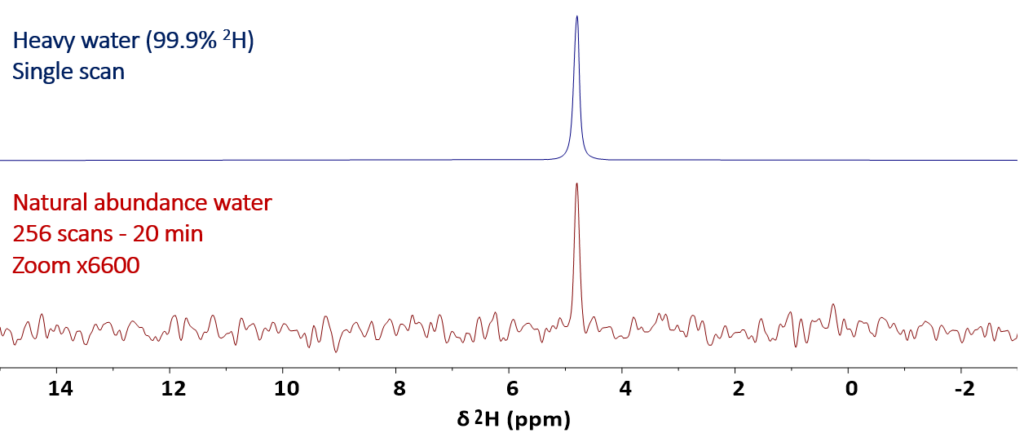
In this blog post we demonstrate that the sensitivity of the Spinsolve benchtop NMR spectrometers is so high, that deuterium spectra of samples containing 2H at natural abundance can be measured in times that are shorter than 1 hour. Figure 1 shows, as a first example, the comparison between the spectrum of deuterated water containing 99.9% 2H acquired in a single scan and the 2H spectrum of regular water containing deuterium at natural abundance (tap water) acquired with 256 scans. To facilitate the comparison of the two spectra, a zoom factor of 6 600 (the factor required to compensate the 2H concentration difference) is used to display the second spectrum, allowing us to view both spectra on a similar vertical scale.
Figure 1: Stacked plot comparing the 1D 2H NMR spectrum of deuterated water (99.9% 2H) (top spectrum) and the 1D 2H NMR spectrum of distilled water containing 2H at natural abundance (bottom spectrum). A vertical zoom factor of 6 600 was applied to the bottom spectrum to make both spectra comparable in scale.
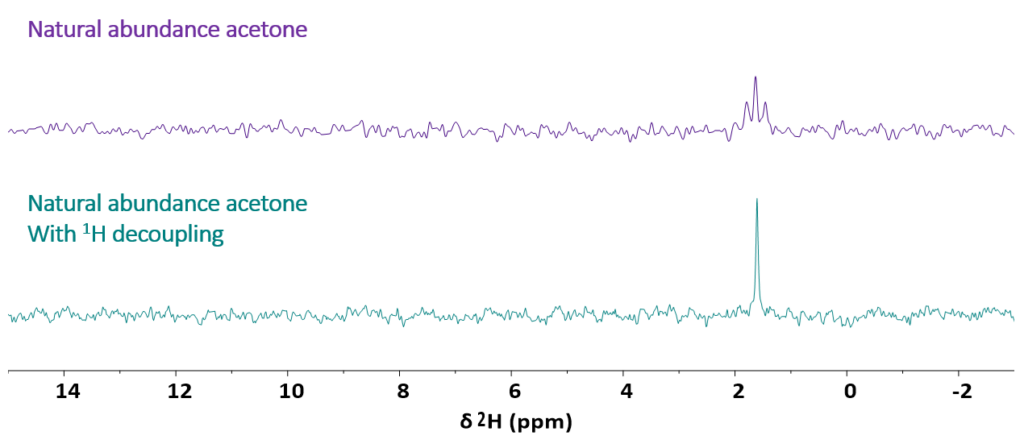
Figure 2 shows, as second example, the spectrum of regular acetone. It exhibits a triplet that corresponds to the signal of deuterium in a -CDH2. The triplet in the top spectrum is due to the J‑coupling of 2H with two 1H (J = 2 Hz). As the Spinsolve spectrometers offer the possibility to acquire the deuterium signal in the presence of proton decoupling, the triplet can be collapsed into a single line to enhance the sensitivity.
Figure 2: Stacked plot comparing the 1D 2H NMR spectrum of natural abundance acetone acquired without (top spectrum) and with (bottom spectrum) 1H decoupling.
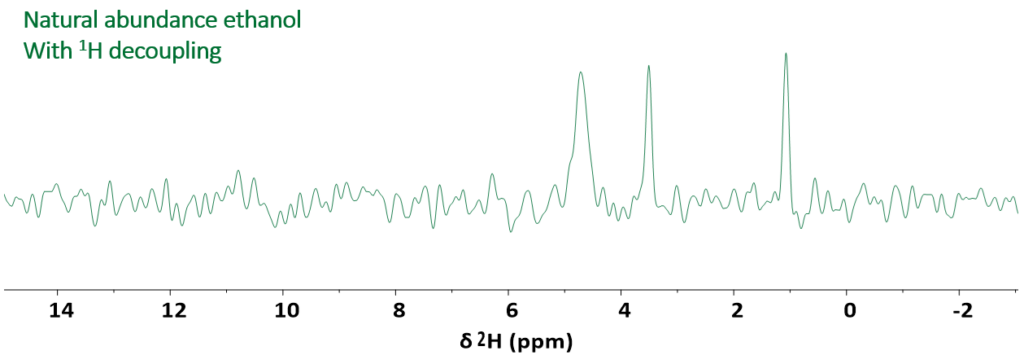
The third and final example, displays the 1D 2H spectrum of technical grade ethanol containing ca. 20% water. This molecule contains three distinct chemical groups that can be directly identified in the spectrum shown in Fig. 3
Figure 3: 1D 2H spectrum of natural abundance ethanol acquired in the presence of proton decoupling in a measurement time of 1 hour.
The examples provided illustrate that the remarkable sensitivity of the Spinsolve system enables users to detect natural abundance deuterium. Therefore, it offers sensitivity that is more than adequate to assist chemists in tracing reaction pathways, especially when typically working with 2H‑labeled molecules.
References:
[1] Mantsch et al., Deuterium magnetic resonance, applications in chemistry, physics and biology, Progress in Nuclear Magnetic Resonance Spectroscopy, Volume 11, Issue 4, 1977, Pages 211-272
[2] Aguayo et al, High resolution deuterium NMR studies of bacterial metabolism., Journal of Biological Chemistry, Volume 263, Issue 36, 1988, Pages 19552-19557,
[3] Polvoy et al.,. Deuterium Metabolic Imaging-Rediscovery of a Spectroscopic Tool. Metabolites. 2021 Aug 25;11(9):570.
[4] GJ Martin and ML Martin, artin, G. J., & Martin, M. L. (1988). The site-specific natural isotope fractionation-NMR method applied to the study of wines, Wine Analysis, Pages 258-275


