Application of the Spinsolve benchtop NMR in Structural Biology
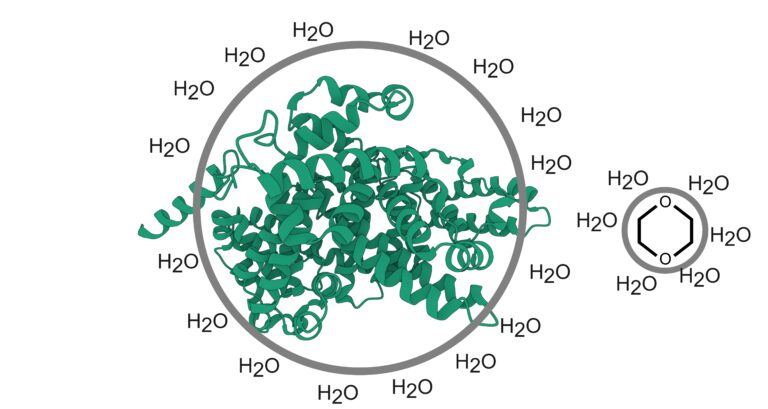
Figure 1. Cartoon representation of bovine serum albumin3,4 and dioxane. The grey circles represent the radius of hydration, a spherical approximation of size plus the excluded water volume.
The size of biomacromolecules in solution is useful in basic structural biology research, as well as to characterize pharmaceutical formulations that contain large biomacromolecules such as proteins or liposomes. Diffusion NMR can be used as an alternative to mass spectrometry, size-exclusion chromatography, and gel electrophoresis to determine the size and oligomeric state of biomacromolecules like proteins. The diffusion NMR approach we examine here is similar to the one presented in earlier blog posts on the determination of the molecular weight of non-biological polymers. In addition, diffusion NMR with the Spinsolve has been previously used to measure protein concentration and aggregation simultaneously1. In another study, a Spinsolve spectrometer was used to monitor a protein enzyme hydrolysis reaction via the measurement of molecular weight with diffusion NMR2. In this work it was shown that the calibration of protein molecular weight versus diffusion was nearly identical on a benchtop Spinsolve spectrometer as compared to high field diffusion NMR measurements2.
Here, we show a related yet distinct diffusion NMR application – the determination of a protein’s radius of hydration, RH, for bovine serum albumin and equine myoglobin. Experimental solutions were prepared in regular water (non-deuterated), phosphate buffered pH 7.4 solution and commercially available lyophilized protein. The results reported in this AppNote confirm that the values measured on a Spinsolve 80 MHz ULTRA Diffusion spectrometer closely agree with the literature values for these two proteins, demonstrating that the Spinsolve spectrometers offer an effective alternative technique for the non-destructive determination of protein size. These RH measurements are useful to show that the resuspended protein is non-aggregated and well-folded
A pulse field gradient diffusion-based NMR experiment (PGSTE sequence) with the incorporation of WET solvent suppression was used to collect data on the protein solution. PGSTE experiments collect a series of 1D 1H spectra with increasing gradient strength to attenuate the signal intensity across the series proportionally to the self-diffusion coefficient D of the molecule. One can determine D by fitting the signal decay to the following equation5,6,7:

Where I0 is the integrated signal for gradient strength g =0,𝛾 is the gyromagnetic ratio, δ is the duration of the gradient encoding and decoding pulses, Δ is the diffusion encoding period between gradient pulses, and D is the diffusion coefficient in m2/s. This equation is known as a Stejskal-Tanner equation7. After fitting the PGSTE NMR data with Eq.1 to obtain the diffusion coefficient, one can then solve for the radius of hydration RH. This parameter is a spherical approximation of molecular size plus the water-excluded volume around a molecule. To find RH from an NMR-measured diffusion coefficient, the Stokes-Einstein equation is used:

To avoid having to separately measure the viscosity η and temperature T of a solution, an indirect method with an internal diffusion standard is used. Equation 2 is rearranged to the following relations since the internal standard and the molecule of unknown size experience the same bulk solution properties, namely temperature and viscosity:
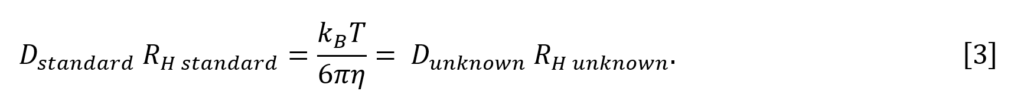
RH for the molecule of unknown size is then calculated as the ratio of the diffusion coefficients for the unknown and the internal standard, multiplied by the RH of the standard. Here we use the often-used internal standard 1,4–dioxane 5,6,7, where RH dioxane is approximately 2.16 Å as measured in the reference5:

Results
The result of the PGSTE WET experiments for the equine myoglobin sample is presented in Fig. 2. The sample contained 31 mg/mL equine myoglobin and 0.2% v/v internal standard 1,4-dioxane in phosphate buffered solution. The water signal has been efficiently suppressed to resolve the signals from the equine myoglobin protein as well as 1,4-dioxane. Two PGSTE WET experiments were run with different settings to measure the diffusion coefficient of the internal standard and the protein with maximum accuracy. Figure 2A shows an experiment collected with the maximum gradient amplitude (0.56 T/m) and relatively short diffusion times (𝛅 = 5 ms, Δ = 20 ms) to minimize attenuation by relaxation. The attenuation of the myoglobin signal as the gradient amplitude is increased is plotted in red in Fig. 2C. The signal of the internal standard overlaps in Fig. 2A with the signal of myoglobin. As the internal standard is a small molecule with long relaxation times and the protein relaxes much faster, a second PGSTE WET experiment was collected with a longer diffusion encoding period (Δ = 500 ms) and smaller maximum gradient amplitude (gmax=0.056 T/m) to use this time as a T1 filter useful to remove the protein signals from the spectrum. Thus, the overlap of the protein and dioxane signal in Fig. 2A is not observed in Fig. 2B. The integral of the dioxane signal is depicted in blue in the Stejskal-Tanner plot shown in Fig. 2C.
The linearity of the dioxane data shows that the protein signal was effectively removed by using a diffusion period Δ of 500 ms. Both data sets were fit to Eq. 1 to obtain the diffusion coefficient for the protein and dioxane. Then, the NMR measured diffusion coefficients were used with Eq. 5 to determine myoglobin’s RH to be 19.4 Å. This RH agrees with the literature value for myoglobin (see Table 1) demonstrating that the NMR measurement has a good accuracy. It is worth noting that this data was recorded in 30 minutes, a time that is shorter than the one required by alternative techniques used to determine protein RH, such as size exclusion chromatography. Moreover, the NMR method simplifies the sample handling.

Figure 2. Myoglobin Radius of Hydration Measurement. A) Superimposed spectra of an equine myoglobin PGSTE WET experiment (16 scans, 8 steps, 33 min, 8 Hz Gaussian apodization, δ = 5 ms, Δ = 20 ms, max gradient = 0.56 T/m). B) Superimposed spectra of an equine myoglobin PGSTE WET experiment (8 scans, 8 steps, 17 min, 3 Hz Gaussian apodization, 𝛅 = 5 ms, 𝚫 = 500 ms, max gradient = 0.056 T/m). For A) and B), the dark to light gradient for each individual spectrum represents the series from smallest to largest gradient power. C) The Stejskal-Tanner plot. The solid lines are the experimentally determined fit, Eq. 1.

Figure 3. Determination of the Radius of Hydration of Albumin by diffusion NMR. A) Superimposed PGSTE WET spectra collected for the bovine serum albumin sample (64 scans, 16 steps, 4.16 hours, 8 Hz Gaussian apodization, δ = 5 ms, Δ = 20 ms, max gradient = 0.56 T/m). B) Superimposed PGSTE WET spectra of bovine serum albumin sample collected with a longer diffusion time to filter the protein signal (16 scans, 8 steps, 33 min, 3 Hz Gaussian apodization, δ = 5 ms, Δ= 500 ms, max gradient = 0.056 T/m). For A) and B), the dark to light gradient for each individual spectrum represents the series from smallest to largest gradient power. C) The Stejskal-Tanner plot for Albumin and dioxane. The solid lines are the fit of the data using Eq. 1.
To further evaluate this approach to determine protein RH by diffusion NMR on the Spinsolve, bovine serum albumin protein at 31 mg/mL, was measured. The experimental details matched that of myoglobin except a greater number of scans were used to increase sensitivity. The amount of signal averaging necessary for a diffusion-based RH measurement is observed to be related to the size of the molecule in question. Overall, molecular size influences the relaxation properties of the NMR signal used for analysis. On one hand, the shorter the relaxation times the larger the signal loss during the PGSTE sequence, and, on the other, the larger the molecule the smaller the dynamic range of the diffusion decay, a factor that limits high field NMR spectrometers as well (discussed in greater detail in the reference5). Albumin’s PGSTE NMR spectra and analysis is shown in Fig. 3 and leads to an RH BSA of 35 Å.
The results obtained from the Spinsolve measurements for both equine myoglobin and bovine serum albumin are summarized in Table 1. Albumin diffuses at half the speed of myoglobin molecules and is therefore measured to be roughly twice the size of myoglobin. The experimental RH values reported here agree, within a few Å, with the values reported in the literature for folded myoglobin and bovine serum albumin. This confirms that the protein is predominately a monomer and that it is well-folded, as expected for a resuspension of the lyophilized protein powder.

Conclusion
Diffusion NMR analysis of proteins has been the subject of much research with high-field NMR. In this application note, we show that the Spinsolve benchtop NMR spectrometers can accurately and non-destructively measure the RH of proteins using a dioxane internal standard. Then, this measured RH could be further used with analytical equations of protein size related to the number of amino acid residues for a folded or unfolded protein5. Thus, diffusion NMR measurements with a Spinsolve spectrometer is useful for structural biology characterizations, like measuring if a protein is folded or unfolded, as well as, the determination of a protein’s dominant oligomeric state in solution.
To Read the Full Application Note CLICK HERE
References
- Grimes, M, et. al. Anal. Chem. 2024; 96: 11155-11162
- McCarney, E. et. al. Magn. Reson. Chem. 2024; 62: 452-462
- Jumper, J. et. al. Nat. 2021; 596: 583-589
- Varadi, M. et. al. Nucleic Acids Res. 2021; 50: 439-444
- Dudás EF, Bodor A. Anal. Chem. 2019; 91: 4929–4933
- Fonda, B., Murray D. Prot. Sci. 2024; 33: e5214
- Wilkins, D., et. al. Biochem. 1999; 38: 16424-1643
- Zhou, H. J. Phys. Chem. B. 2002; 106: 5769-5775