Maximizing signal-to-noise ratio per measurement time by using the advantages of magnetization transfer in 29Si–1H-HMBC spectra.
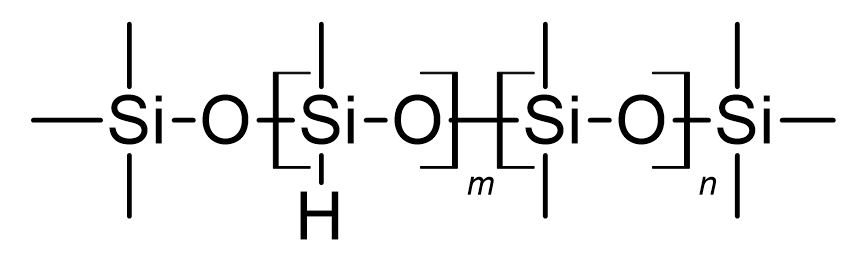
In a previous application note we discussed how the copolymer composition and average molar mass of poly(dimethylsiloxane-co-methylhydrosiloxane), trimethylsilyl terminated (Figure 1) can be determined by 29Si-DEPT NMR spectra and using a well characterized sample of the same substance as external standard (Blogpost).
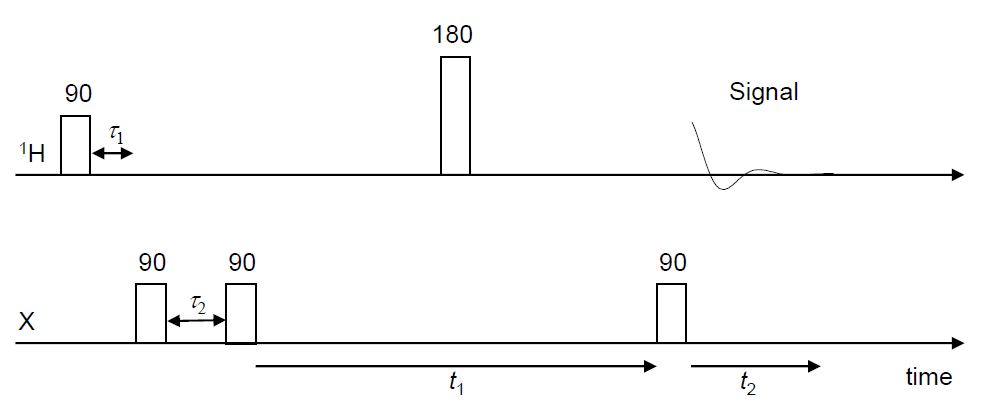
The determination of the average molar mass of large samples of this polysiloxane is not feasible with directly detected silicon 1D NMR, since the signals of the end groups are extremely weak. The generally accepted minimum value for SNR required for reasonable quantification is 10. By employing DEPT spectra and taking advantage of magnetization transfer from protons to silicon nuclei we achieved SNR values greater than 40 for the end groups of polysiloxanes with average molar masses below 10.000 g/mol within 11.5 hours of measurement. Additional improvement in SNR per unit time can be obtained by transferring the magnetization back to protons. This principle forms the basis of two-dimensional heteronuclear NMR spectroscopy. In this application note 29Si–1H-HMBC (heteronuclear multiple bond correlation) (Figure 2) is used, as the signals of the directly coupled Si–H are filtered out while only long-range Si–H couplings show signals.).
Recording a 29Si–1H-HMBC spectrum
The next figure depicts an HMBC spectrum of the polysiloxane in question, recorded on a Spinsolve 80 MHz Ultra Multi-X benchtop NMR spectrometer (Figure 3). Accumulating eight scans for 256 t1-increments with a repetition time of 5 s results in a total measurement time of approximately 3 h.
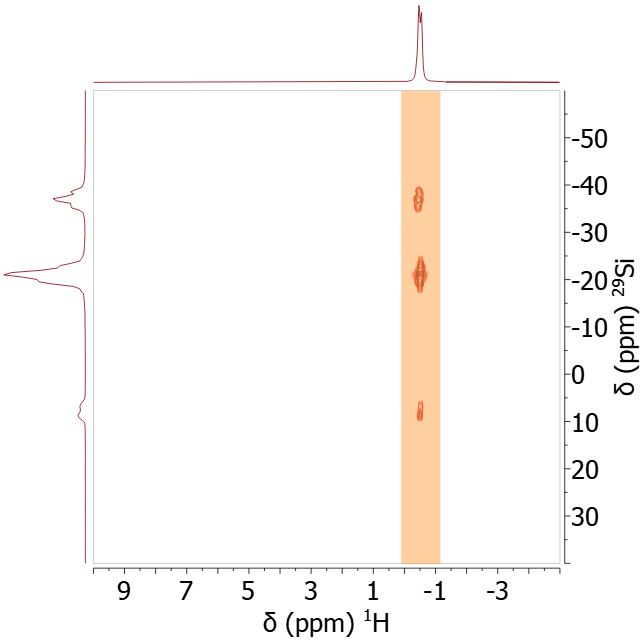
The three signals corresponding to the three different groups, two copolymers and the end group, are well resolved. The silicon spectrum on the vertical axis (vertical trace) was obtained by summing all vertical slices contributing to the peaks, which in this case comprises 64 slices marked by the orange rectangle. The resulting vertical trace was then extracted as a 1D 29Si spectrum, baseline-corrected, and compared with the DEPT spectrum.
Comparing SNR values between DEPT and HMBC
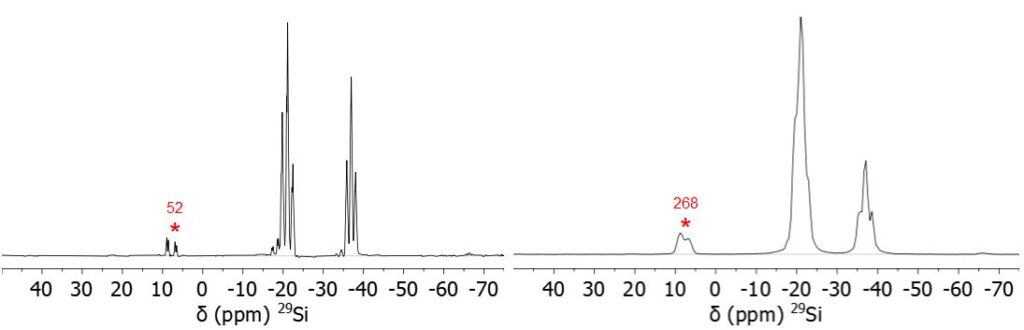
Figure 4 compares the DEPT spectrum (left) with the vertical trace extracted from the HMBC spectrum (right). The lower resolution of the HMBC spectrum is expected, as only 256 t1 increments were recorded. With zero-filling to 512 points and a spectral width of 250 ppm, the resulting digital resolution is 7.7 Hz. In contrast, the 1D DEPT spectrum was acquired with 8192 points and zero-filled to 16384 points, yielding a digital resolution of 0.3 Hz at a spectral width of 314 ppm. It should be noted that this loss of resolution does not affect the determination of the copolymer composition, since the three groups remain well separated in the vertical trace of the HMBC spectrum.
The following table illustrates the striking gain in signal-to-noise achieved in conjunction with a fourfold reduction in measurement duration.
|
SNR DEPT |
Measurement time DEPT |
|
SNR HMBC |
Measurement time HMB |
|
52 |
680 min |
|
268 |
171 min |
For a valid SNR comparison, the expected SNR of the DEPT measurement was calculated for a measurement time of 171 min corresponding to that of the HMBC experiment:
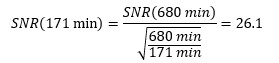
With the difference in measurement time accounted for, an SNR enhancement of over 10 is achieved by measuring HMBC compared to DEPT experiments.
Quantifying peaks in the HMBC spectrum
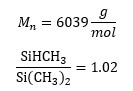
The sample used for this demonstration (Polymer 1) was previously characterized (AppNote) and exhibits the following values for average molecular weight and copolymer ratio:
To obtain quantitative information, the response factors for the three different signals need to be determined. These factors are obtained by comparing the integrals of a 1H measurement acquired under quantitative conditions with the integrals from the HMBC measurements:
Signal [ppm] | Quantitative Integral [a. u.] | Integral HMBC [a. u.] | Response factor |
5 – 10 | 2.00 | 18.23 | 0.110 |
-24 – -17 | 43.22 | 189.31 | 0.228 |
-39 – -32 | 44.43 | 68.02 | 0.653 |
These response factors were used to convert the integrals from an HMBC spectrum of a second sample of the same polymer type (Polymer 2) into quantitative values, which were then used to calculate the following results:
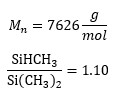
These results are in excellent agreement with the previous DEPT analysis (average molecular mass 7449 g/mol and copolymer ratio 1.10). The HMBC spectrum was acquired in 3 h to achieve a fivefold higher SNR compared to the DEPT measurement yet still required substantially less time than the 11 h DEPT experiment. Notably, if the same SNR as the DEPT were targeted, the HMBC measurement could be accelerated by a factor of 100, resulting in a total measurement time on the order of 10 minutes.
Conclusion
In a previous application note (Link) we utilized magnetization transfer from proton to silicon in DEPT experiments to enable the full characterization of polysiloxanes that are too large for standard end group analysis. Here, we apply a second magnetization transfer back to protons, as implemented in an HMBC spectrum which increases the accumulated SNR per unit measurement time by a factor of ten. Furthermore, by using a previously characterized sample of similar size to determine response factors, fully quantitative HMBC spectra could be obtained.
To Download the Full App Note CLICK HERE