The stability of the magnetic field is an important factor in NMR spectroscopy. Field drifts over the course of a long experiment lead to artifacts in the data. These can manifest themselves as additional line broadening in 1D spectra, as well as vertical stripes (the so-called T1 noise) in a 2D spectrum. High frequency stability is the key to being able to measure low concentration samples as well as undistorted 2D spectra and can be enabled by using an NMR lock.
Signal averaging
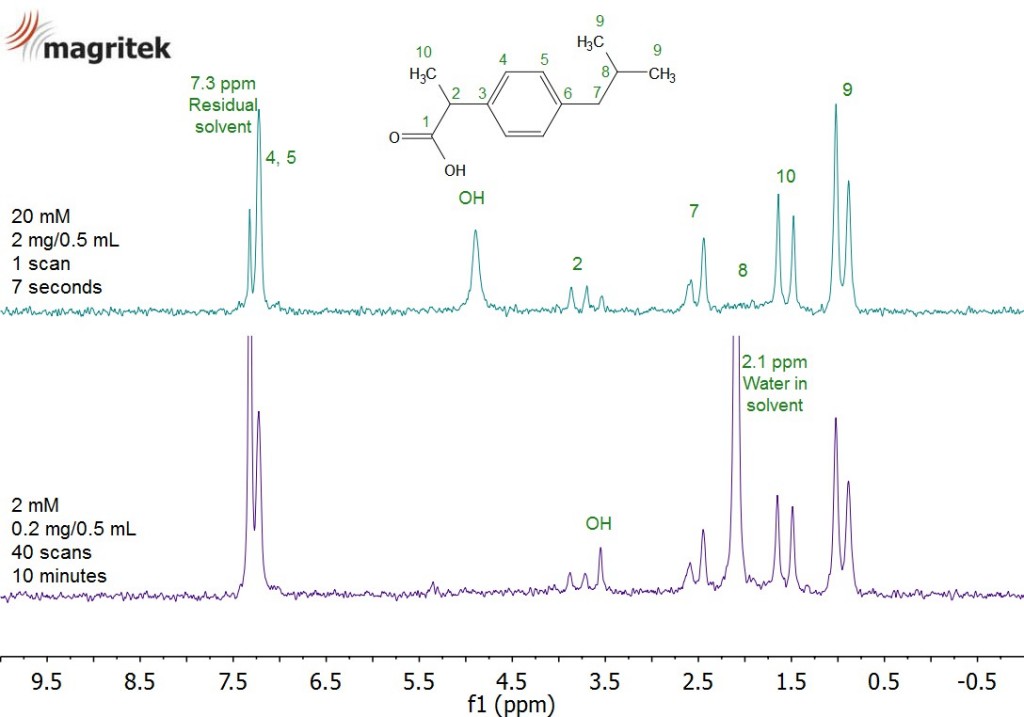
Let’s look at a low concentration sample where we need to signal average in order to get sufficient signal-to-noise. If the linewidth is 0.5 Hz and the frequency drifts by more than the linewidth over the course of the experiment, the averaged spectrum will be broadened. The figure below shows the spectra of two dilute samples of ibuprofen in CDCl3 with different concentrations. The first sample has a concentration of 20 mM and gives sufficient signal in a single scan. The second sample is with 2 mM ten times more dilute and has been signal averaged for 10 minutes in order to give similar signal-to-noise ratio to the first one. Apart from solvent-specific features and the concentration dependent shift of the hydroxyl peak, both spectra are very similar. In particular, this experiment demonstrates that there is no additional line broadening introduced by signal averaging.
Two-dimensional spectroscopy
A second example where field stability is important is two-dimensional (2D) NMR spectroscopy. In a 2D experiment, a series of 1D data is recorded. The way the individual 1D data are collected differs only by a time increment which is introduced between scans. The most common 2D NMR experiment is the COSY (COrrelation SpectroscopY) experiment, which provides information about which protons are close to each other in a molecule.
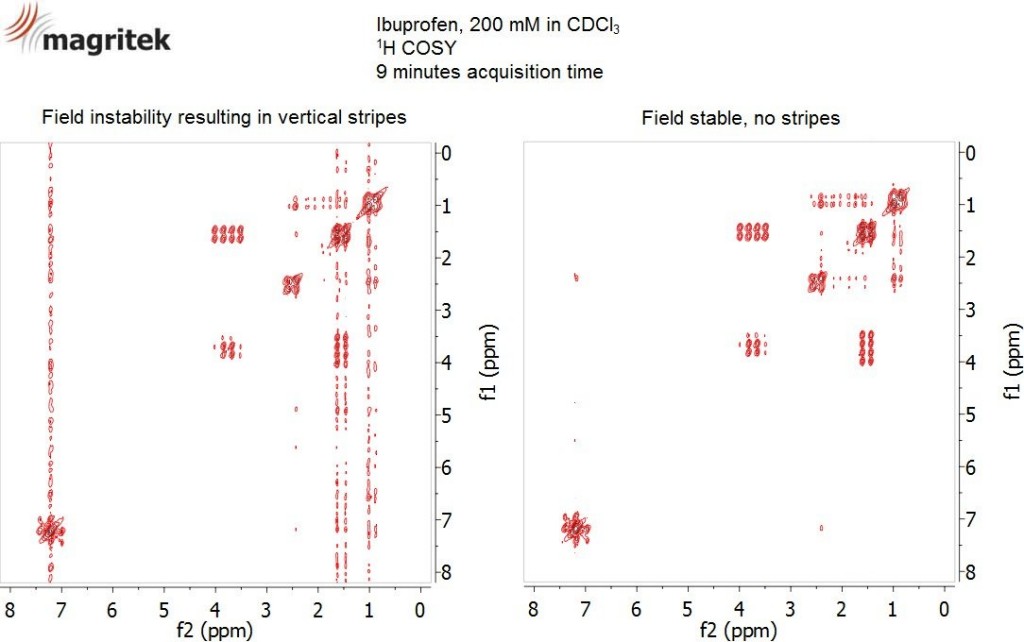
The figure below shows two COSY spectra of the same sample (ibuprofen in CDCl3). The spectrum on the left shows strong vertical stripes. Such stripes in a 2D spectrum are known as T1 noise and are typical for field or frequency instabilities during the experiment. For this measurement we deliberately used a system with a known field instability. As a comparison, a typical 2D COSY spectrum is shown below on the right side. It is clean and indicates a stable system.
Where do the frequency fluctuations come from?
Benchtop NMR systems are based on permanent magnets. These permanent magnets are made from rare-earth alloys, which have a very strong temperature dependence in their field strength. Their typical temperature coefficient is about -0.03% per degree C. This does not sound like much at all, but for a 1 Tesla magnet this corresponds to a frequency shift of -12 kHz if the magnet temperature is raised by one degree! Considering that the normal frequency spread of the proton signal is only about 10 ppm, or 430 Hz at 1 Tesla, it becomes evident how important it is to decouple the magnet temperature from the fluctuating room temperature.
How to control the frequency fluctuations
All benchtop NMR magnets are operated at a temperature several degrees above normal room temperature. A control unit with a temperature sensor and heater keeps the magnet at constant temperature, compensating for fluctuations in the room temperature. This is not as simple as it sounds. For example, in order to keep the resulting frequency drift smaller than 1 Hz, the magnet temperature fluctuations will have to be smaller than 0.1 mK. Considering that one wants to keep the frequency fluctuations well below the linewidth, which is on the order of about 0.5 Hz for our benchtop NMR spectrometers, the magnet temperature needs to be stabilised to about 0.01 mK. This shows that even the slightest temperature fluctuation can lead to significant frequency drift if not taken care of.
This is where the frequency lock comes into play. The lock measures the frequency at regular intervals and keeps the magnetic field constant by generating a correction field. Since this field is produced by passing an adjustable current through a coil, it can only correct frequency drifts within a few hundred Hz so the system must already be very stable before you can use a lock.
How to check stability
This all sounds rather complicated, doesn’t it? But the user does not need to worry about the ins and outs of frequency fluctuations. All that matters at the end is whether the stability is good enough, and to check that, a direct NMR measurement is the best tool. After all, NMR is measuring on a sub-ppm scale, this is better than 1 part per million! Try to measure with that precision the temperature using a thermometer or the frequency using an oscilloscope, and you soon realise how accurate an NMR measurement is.
The following NMR stability tests can be run on NMR instruments to check the field stability
- Take a reference sample with narrow lines and compare the linewidth of a single-scan spectrum with a signal averaged one over a longer duration. The linewidth should remain constant.
- For a longer test, take the same reference sample and measure a single scan NMR spectrum every two minutes. At the end of the test stack the NMR spectra on top of each other, you should see no drift of the peak or change in the lineshape.
- Run a 2D COSY and check for T1 noise.
If your NMR system can pass the tests above then it is a good indication you have sufficient stability to collect accurate and high quality 1D and 2D NMR spectra