Essential oils are mixtures of volatile chemical compounds typically extracted from natural raw materials of plant origin. They consist of terpenes/terpenoid derivatives and phenolic compounds generally obtained by distillation or direct mechanical processing [1]. The term “essential” refers to the oil being the “essence of” the plant’s fragrance, but it can also indicate that the oil has biological importance for the plant itself. It should not be confused with the term essential amino acids as “essential” oils are not indispensable for the human body. In this short blog post, we explore the potential of the Spinsolve benchtop NMR systems to contribute to the instrumental analysis of essential oils. This can both help the identification of essential oil components as well as aid governmental regulations for adulteration. This adulteration is estimated to concern around 80% of all commercially available “natural” essential oils [2].
Figures 1 and 2 show the 1H and 13C NMR spectra of a set of neat essential oils samples acquired on a Spinsolve 80 MHz. The 1H spectra were with a single scan in just 15 seconds per sample. To remove the carbon satellites from the 1H spectra, the signal was acquired in the presence of carbon decoupling. The respective 13C NMR measurements were acquired with 1024 scans, 3 seconds repetition time, and 45° excitation pulse, defining a total measurement time per sample of about 50 minutes.
One can nicely observe that both 1H and 13C NMR spectra show signals that are characteristic of the different molecular structures. These signals are a finger print of each product that can be used for the identification and quantification of the different compounds. As an example, it can be quickly noticed how similar orange oil and blood orange oil are. This is simply because both consist mostly of the chemical compound, limonene.
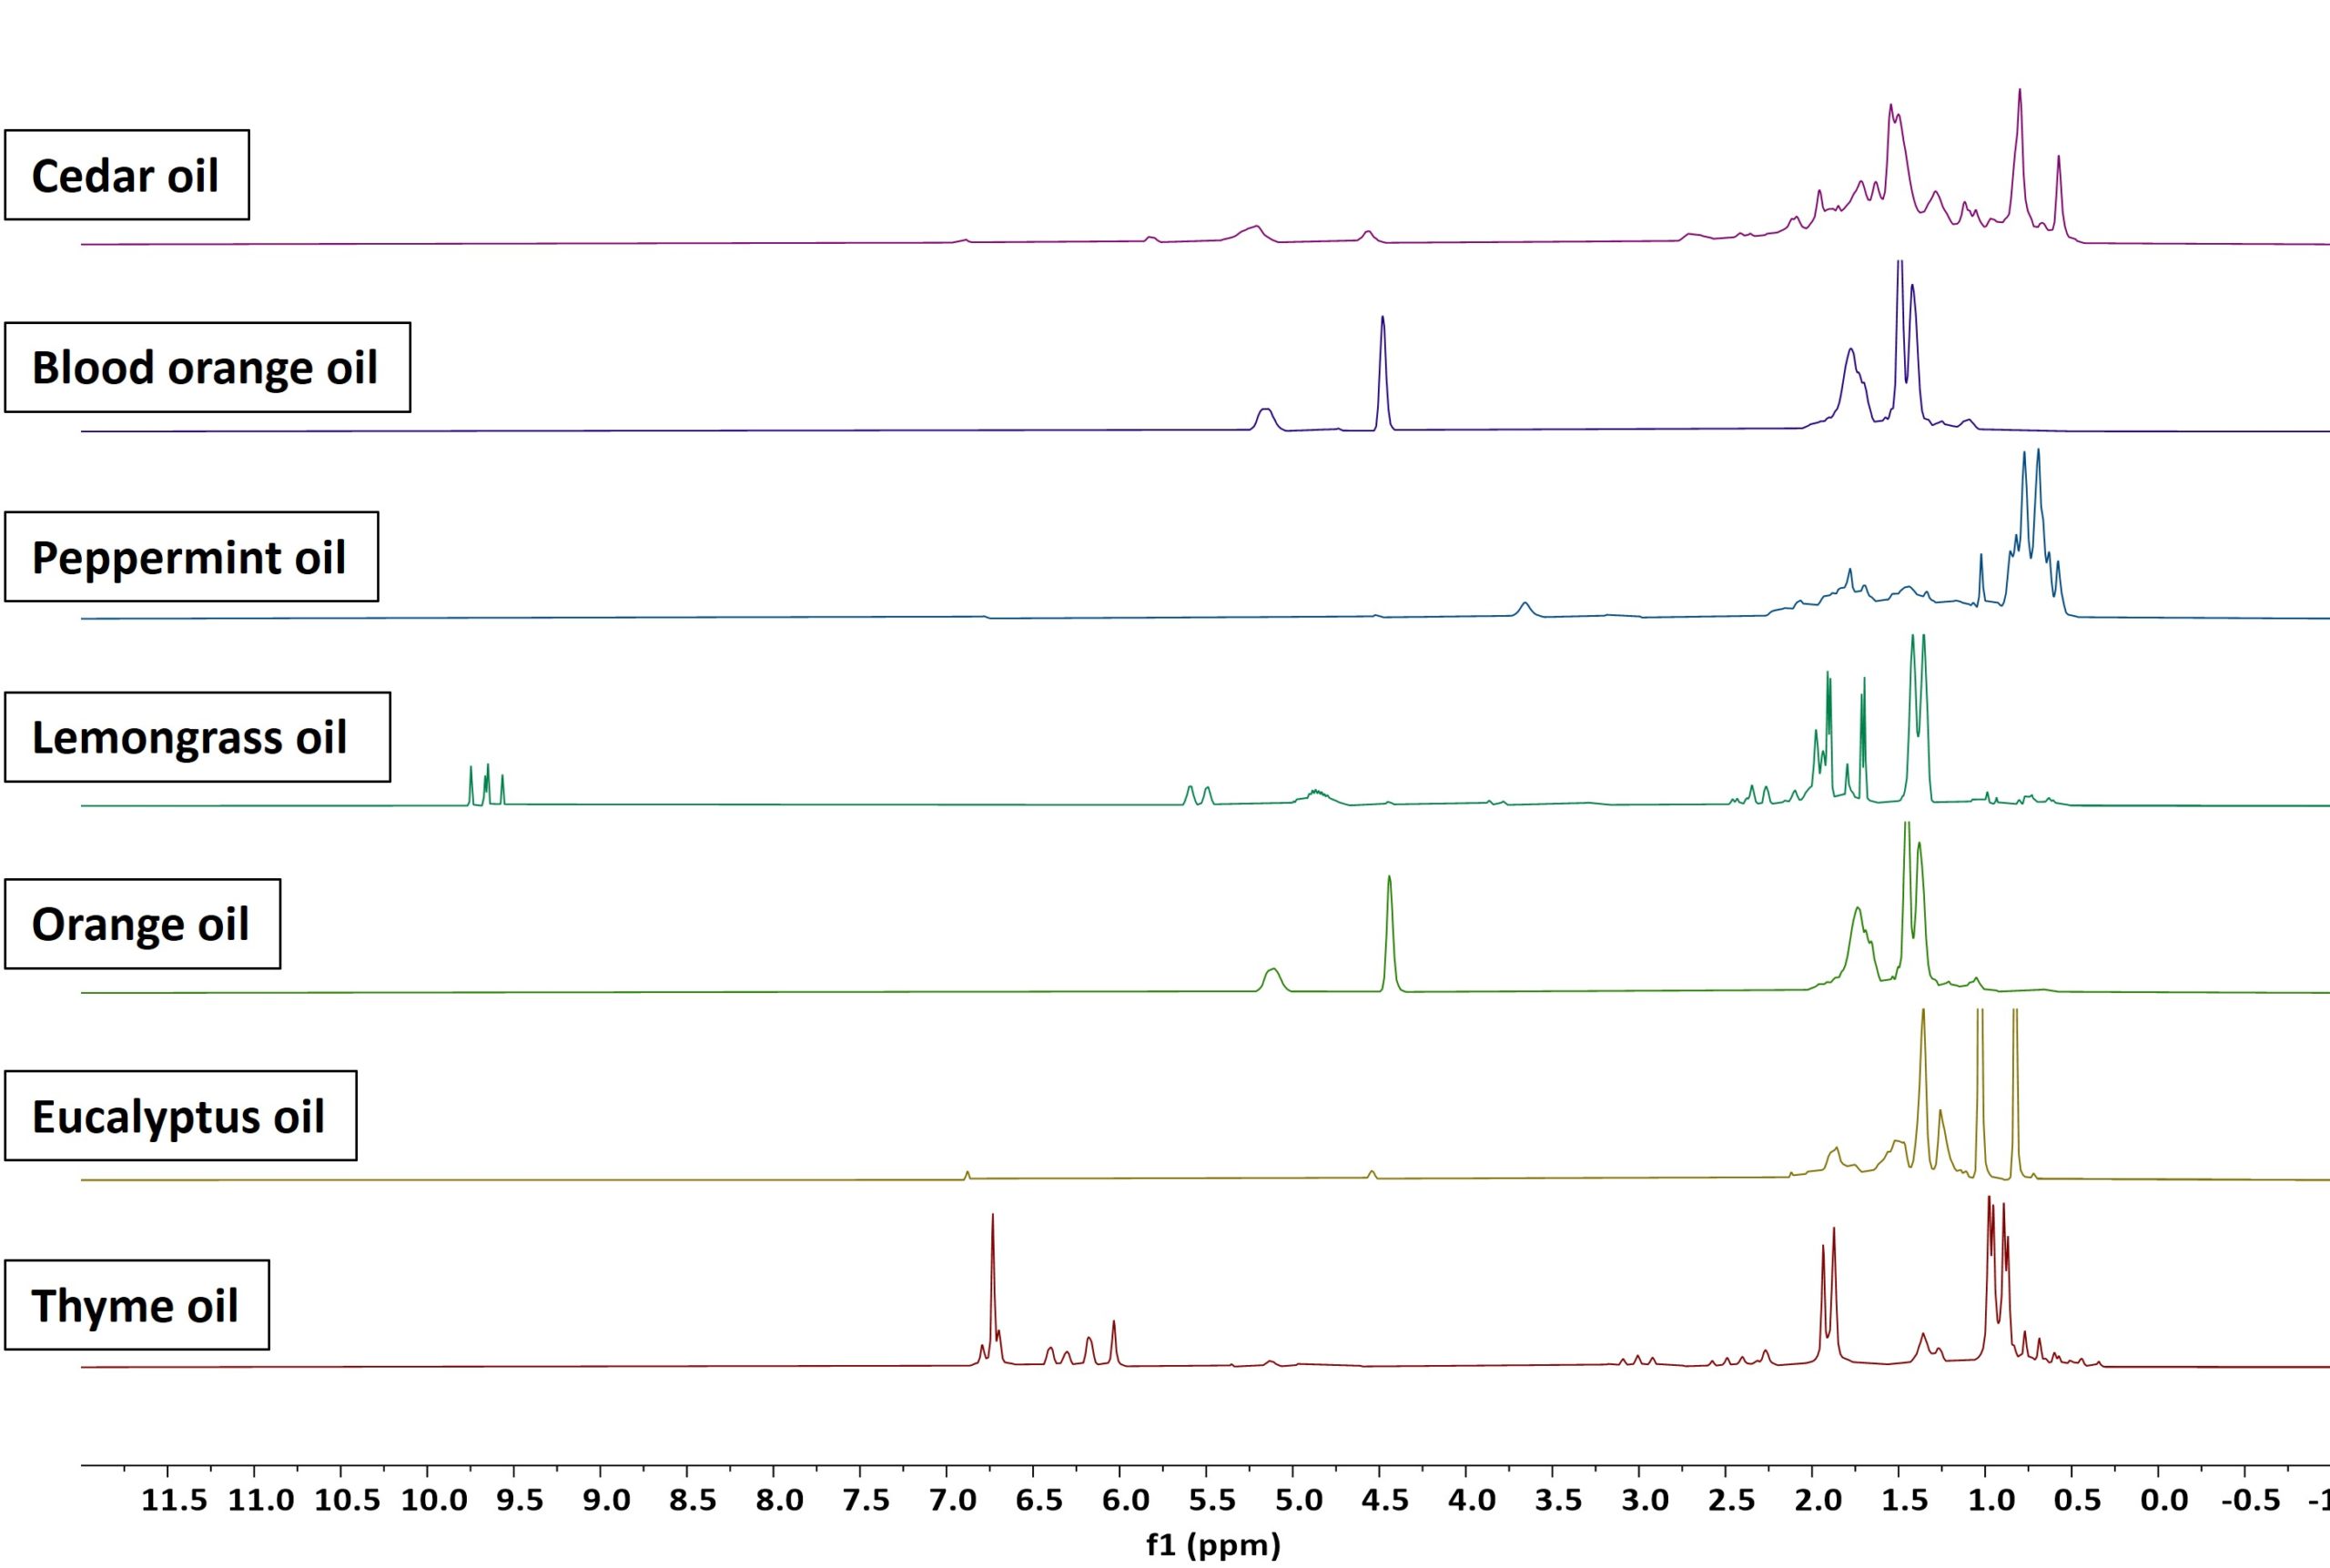
Figure 1: 1D 1H NMR spectra of a range of different essential oil samples measured on a Spinsolve 80 MHz system.

Figure 2: 1D 13C NMR spectra of a range of different essential oil samples measured on a Spinsolve 80 MHz system.
To demonstrate the type of information that can be obtained from these spectra, we took a closer look at the essential oil derived by steam distillation from lemon grass (Cymbopogon flexuosus). This species is mostly found in India and Sri Lanka. It is important to mention that the chemical composition of an essential oil strongly depends on the genetical species of the plant, but also on the geographical origin and climatic conditions at which the plant was cultivated. In this regard, the Spinsolve benchtop systems can also enable a quality assessment of the chemotype and thus origin of a range of essential oils [3]. Figure 3 and 4 show the 1D 1H and 13C NMR spectra of a lemon grass essential oil recorded on a Spinsolve 80 MHz spectrometer. Four of the most frequent components could be easily identified, and their characteristic signals are marked with different coloured hexagons in the figures. The two main constituents are the two cis-/trans-isomers geranial and neral, also often referred to as Citral A and B. For these two components, especially the respective aldehyde signals at around 9.7 ppm (orange, purple) as well the double bond proton signals at around 5.5 ppm (blue) in the 1D 1H NMR spectrum enable identification and discrimination of both compounds. In addition, the two compounds geraniol and geranyl acetate could be identified as minor constituents of this respective essential oil. Here, their respective CH2 signals are marked in green and black, respectively, while the CH double bond signals are marked in yellow, respectively. Relative quantification of the individual components of this lemon grass oil sample results in an amount of geranial, neral, geraniol, and geranyl acetate of 48%, 40%, 8%, and 4%, respectively. This quantification was done by assuming these four components were the only components in this mixture to add to 100%.
The 1D 13C NMR spectrum with its larger chemical shift range and its intrinsically better peak resolution clearly appears as a more powerful option for compound identification, compared to 1H NMR. The most characteristic signals for the four compounds are again marked with the same colour coding. The geranial and neral aldehyde signals are marked in orange and purple, the additional double bond signals in blue and red. The representative geraniol and geranyl acetate CH2 signals are marked again in green and black. The good resolution observed on the 13C NMR spectra of the different samples speaks in favor of using 13C NMR for fingerprinting. The development of a database for essential oils can provide a powerful tool for the identification of components that enable a faster recognition of adulterated samples.
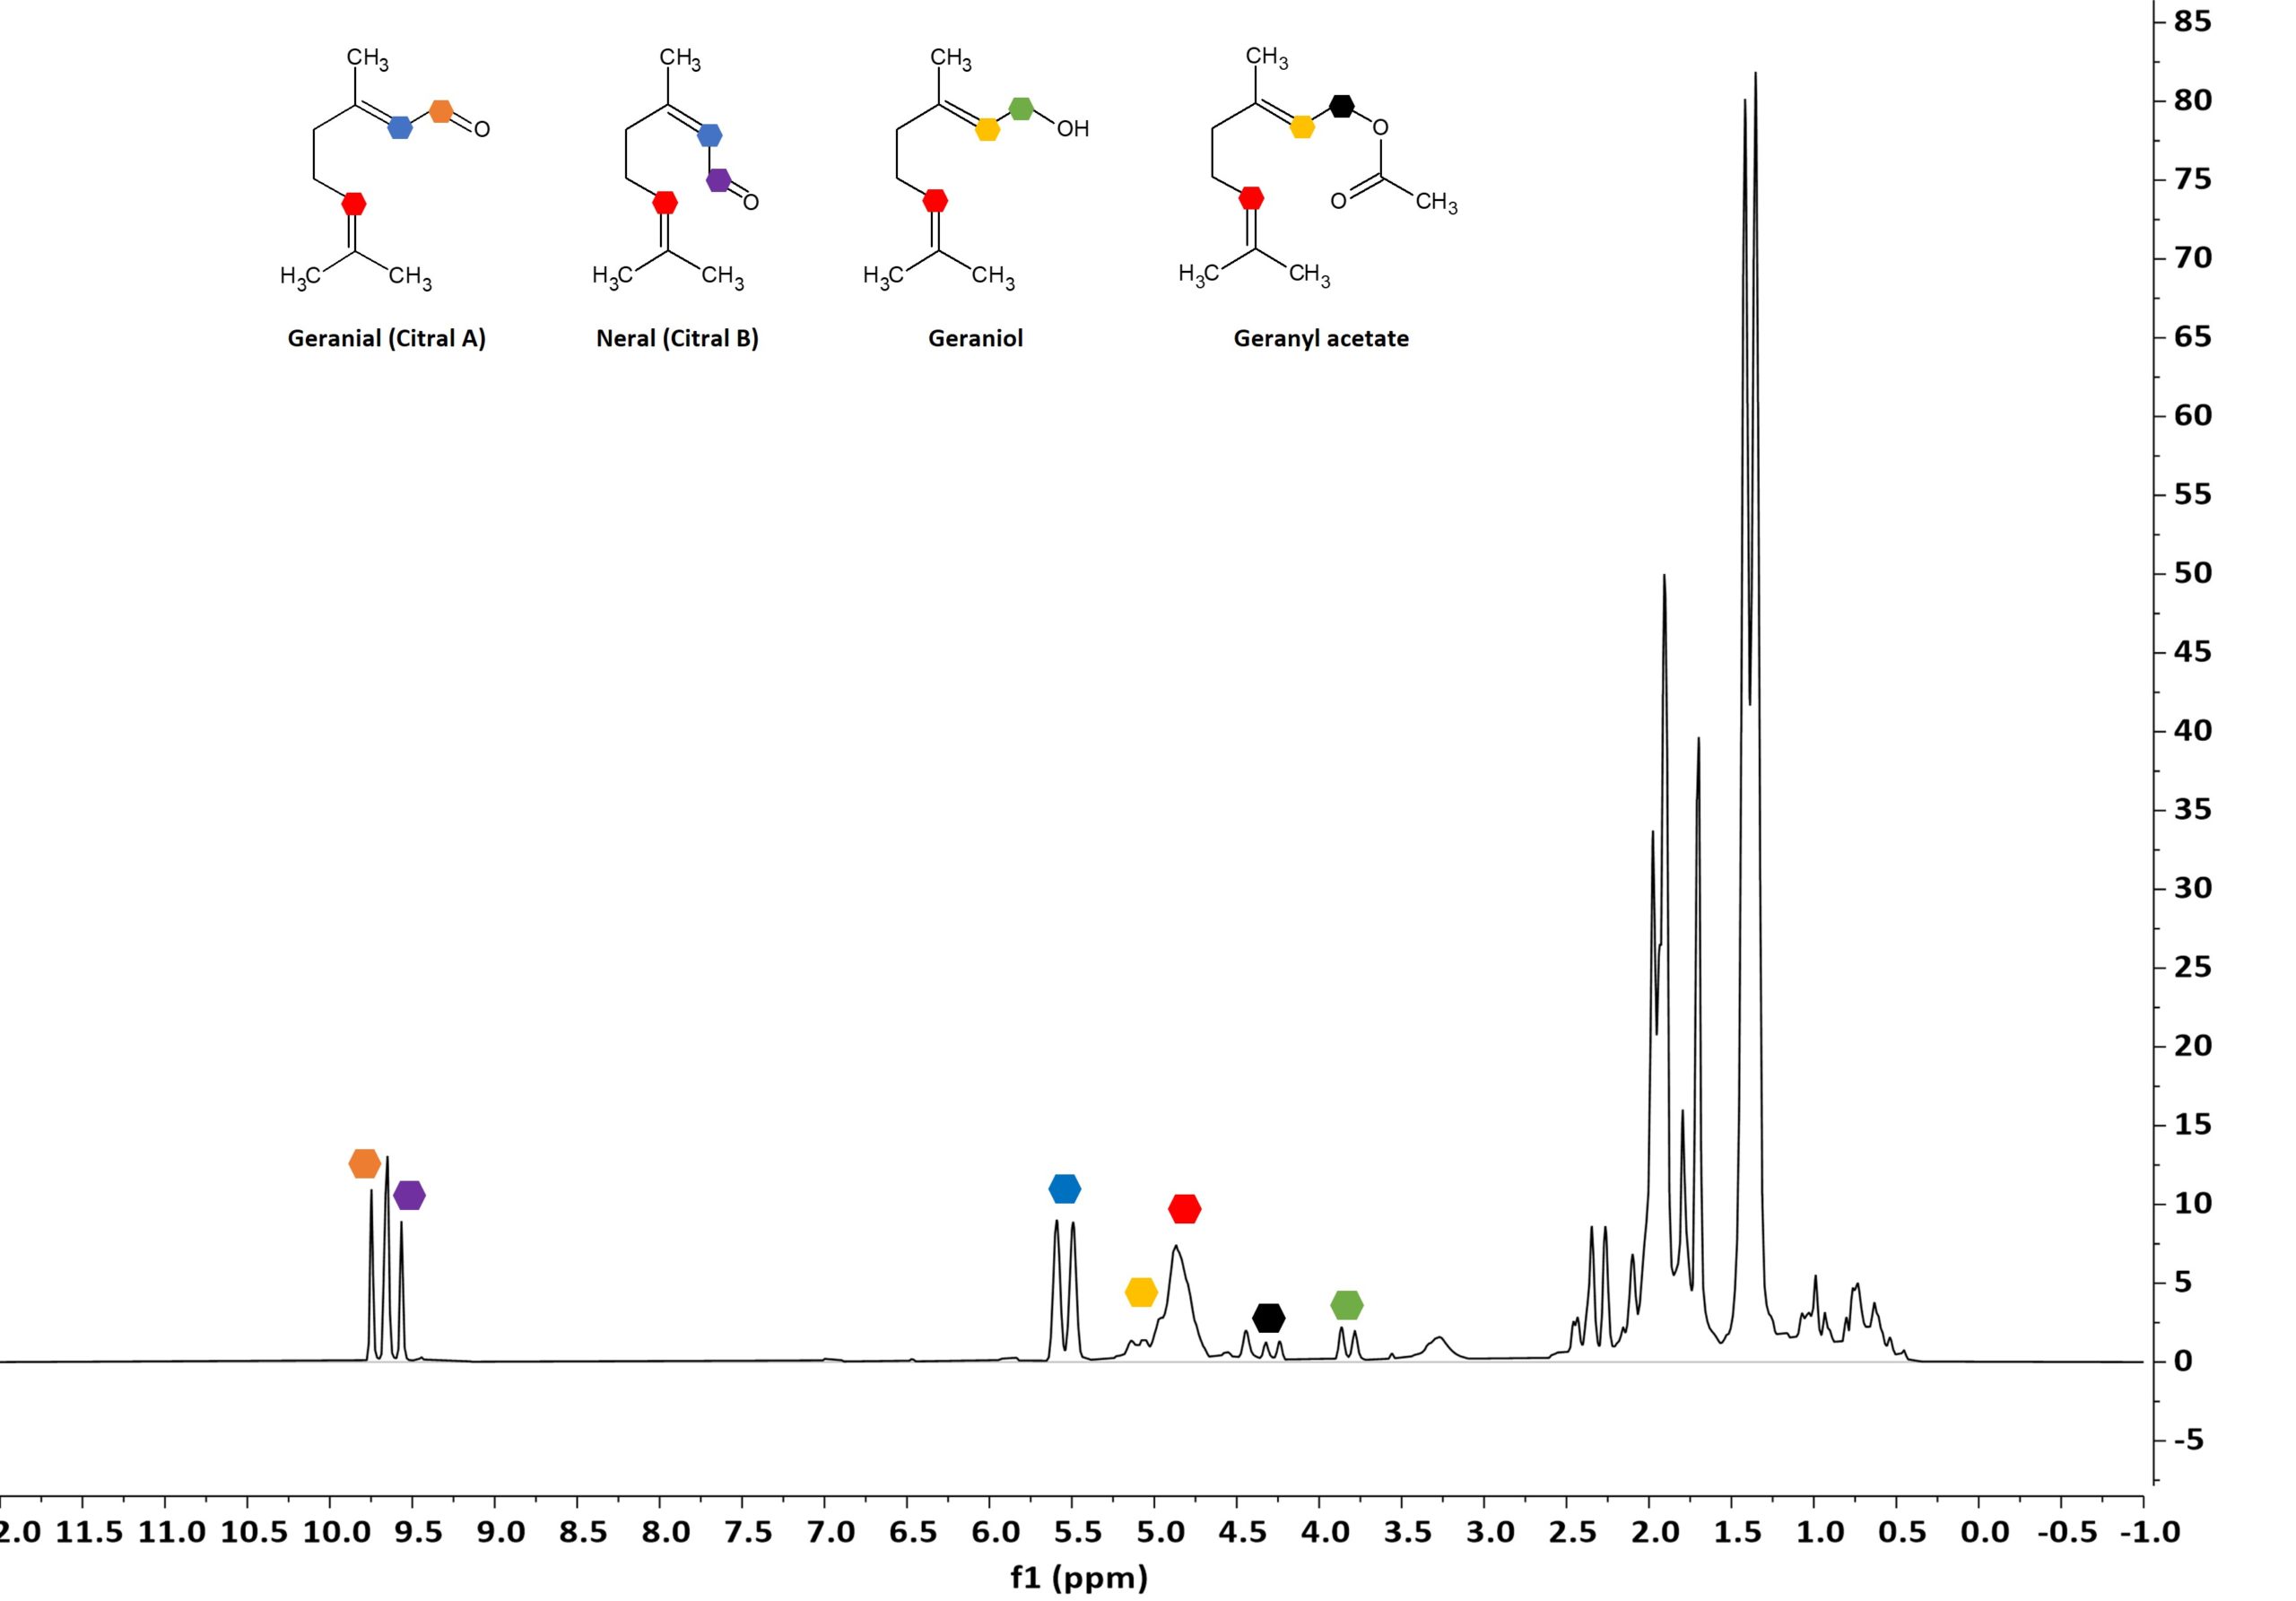
Figure 3: 1D 1H NMR spectrum of a representative lemon grass oil. Individual component signals are marked with the given color coding.
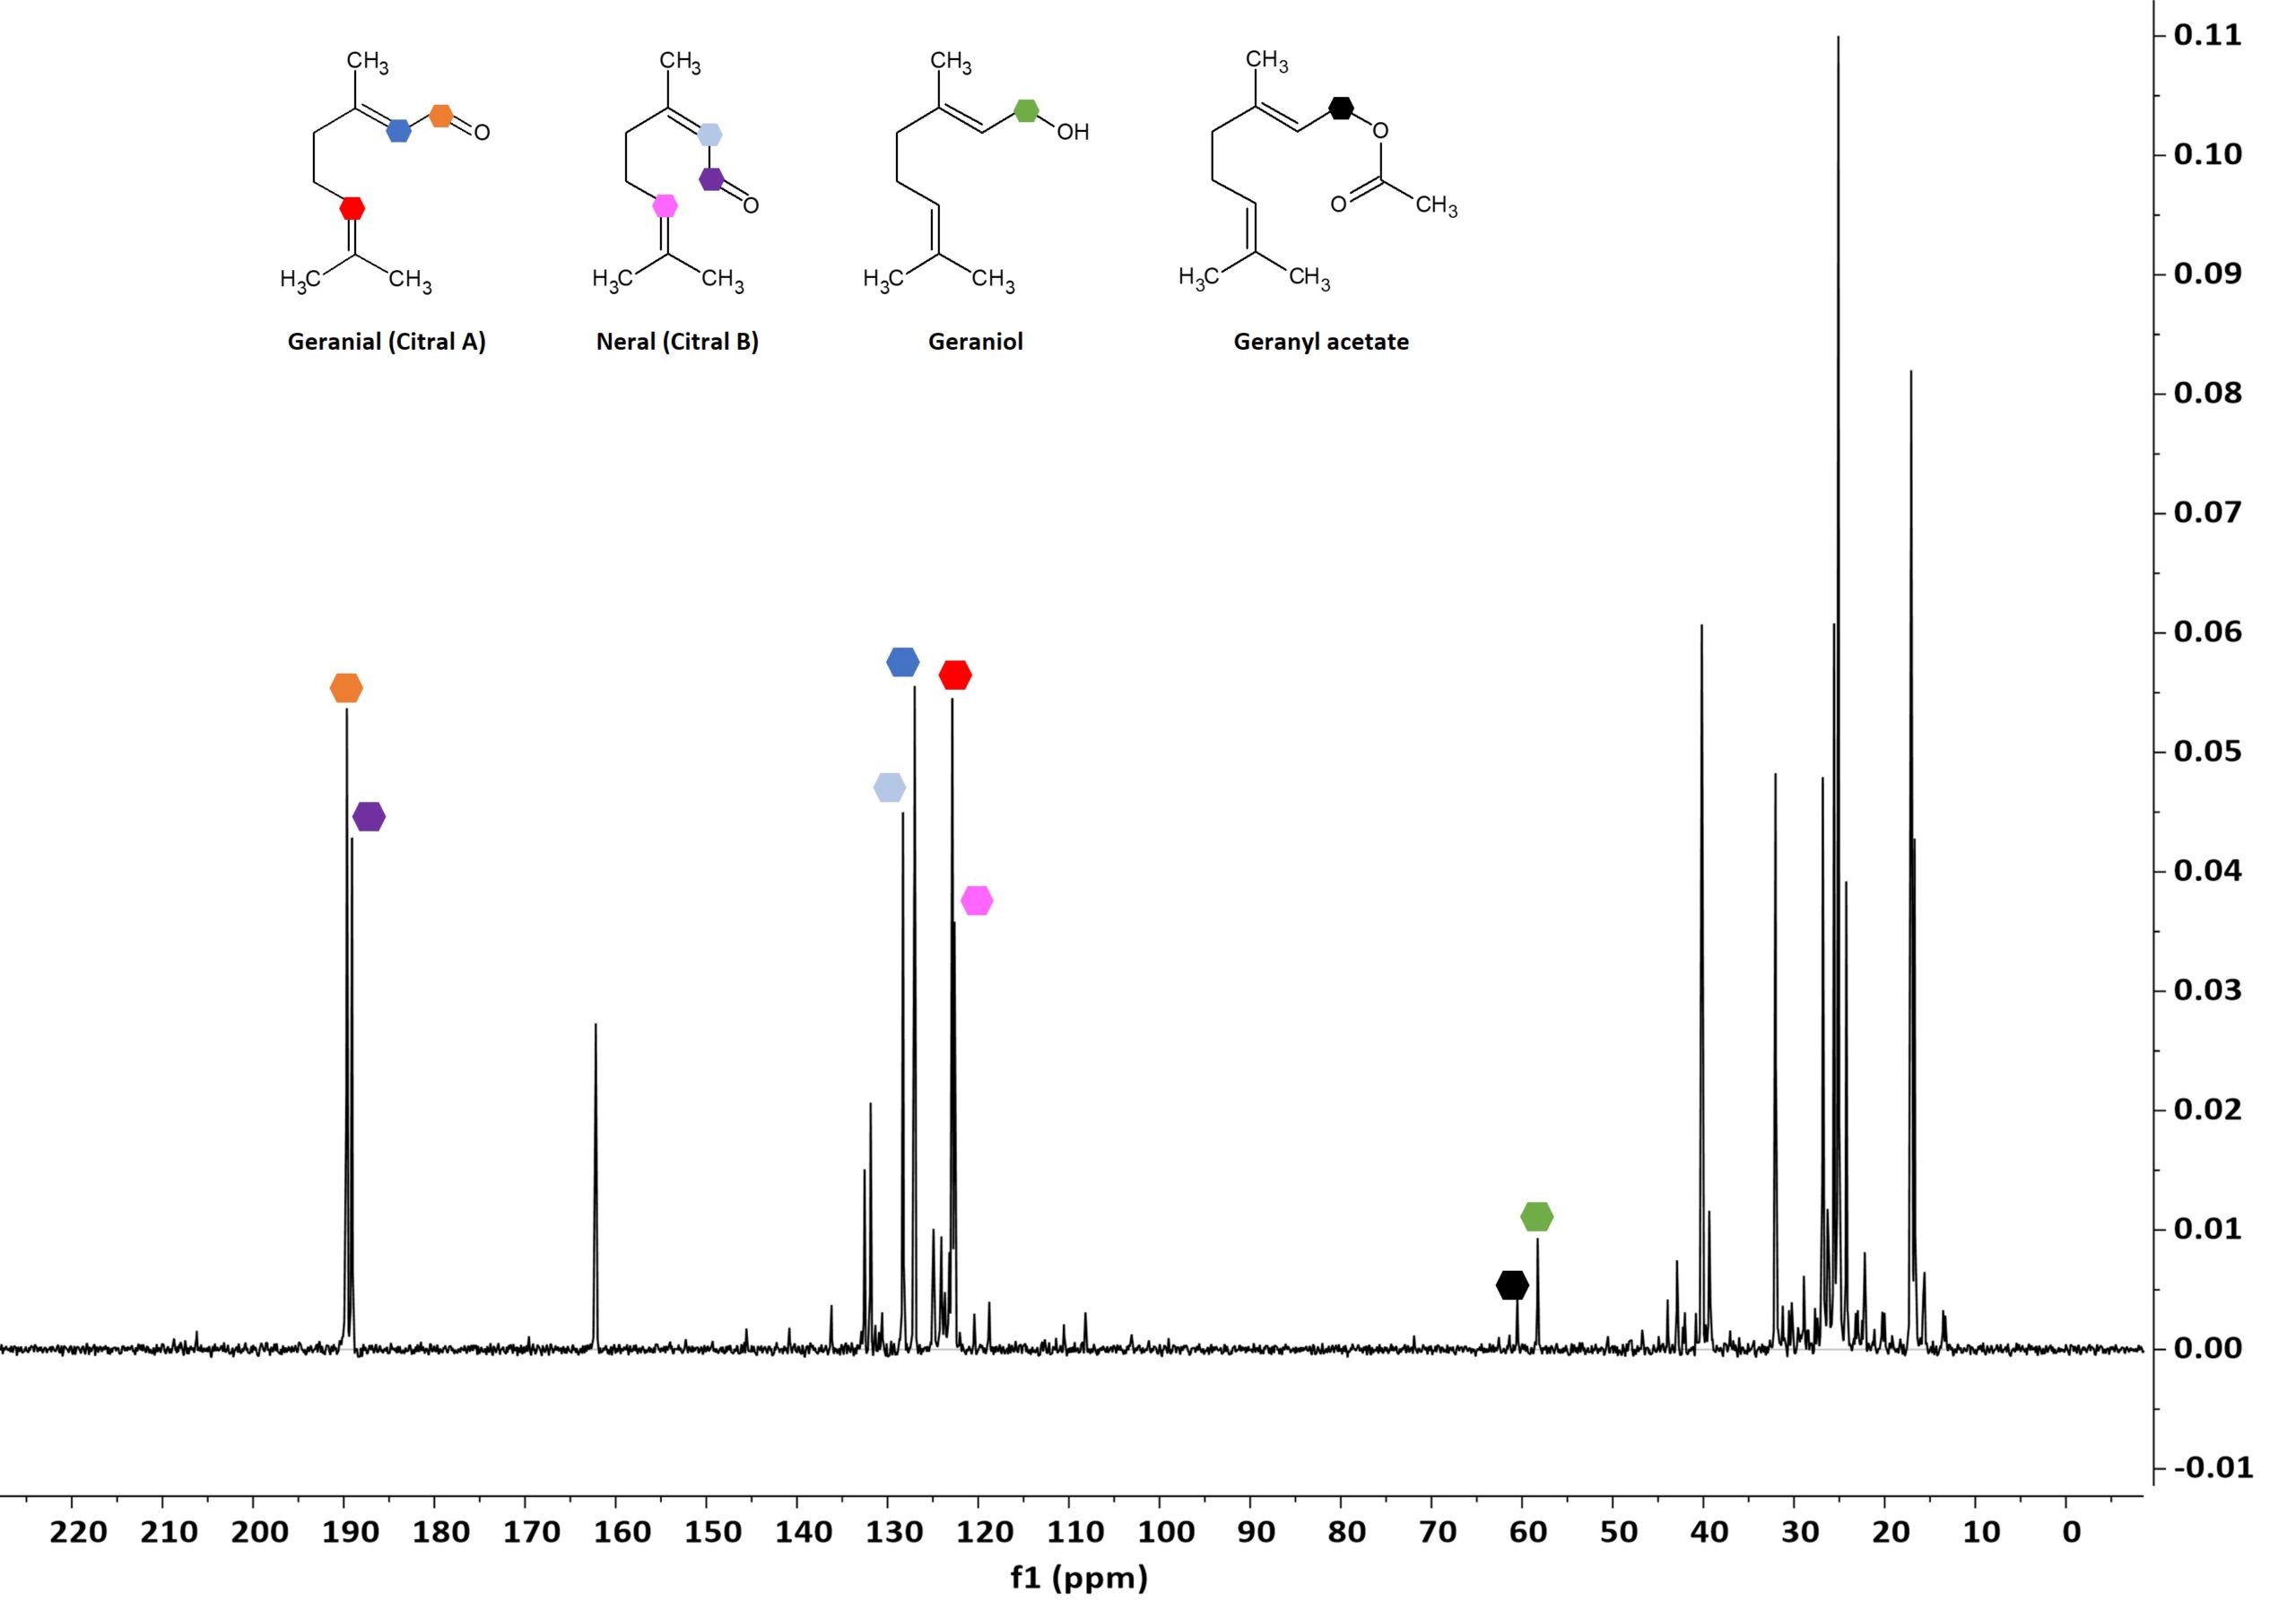
Figure 4: 1D 13C NMR spectrum of a representative lemon grass oil. Individual component signals are marked with the given color coding.
As mentioned above, the quality control of essential oils is very important for both economic as well as safety reasons. Adulteration is commonly observed along supply chains where often cheaper essential oils, cheap synthetic components, or a variety of vegetable oils are used to dilute higher priced, high quality pure essential oils [1]. Figure 5 reports the 1D 1H overlayed NMR spectra of two lemon grass oil samples of different quality. Both spectra were recorded on a Spinsolve 80 MHz system in 4 scans and a total measurement time of 1 min. The upper plot shows the spectra in full scale and the bottom one is vertically zoomed by a factor 20. The cyan spectrum (sample 1) clearly shows the dominant characteristic signals of an adulterant in the region around 0.5 and 1.0 ppm and a doublet signal at around 3.75 ppm. These signals can most likely be attributed to a saturated fatty acid ester component used to dilute the essential oils components. The red spectrum (sample 2) shows the higher quality lemon grass essential oil with the expected characteristic signals. These characteristic signals are also present in sample 1, but at a much smaller concentration. A relative quantification of the components of sample 1 revealed that the two pure essential oil components Citral A and B result in a combined amount of only 15 %. Here it was assumed that geranial (Citral A), neral (Citral B), and the adulterant are the only components present in the mixture.
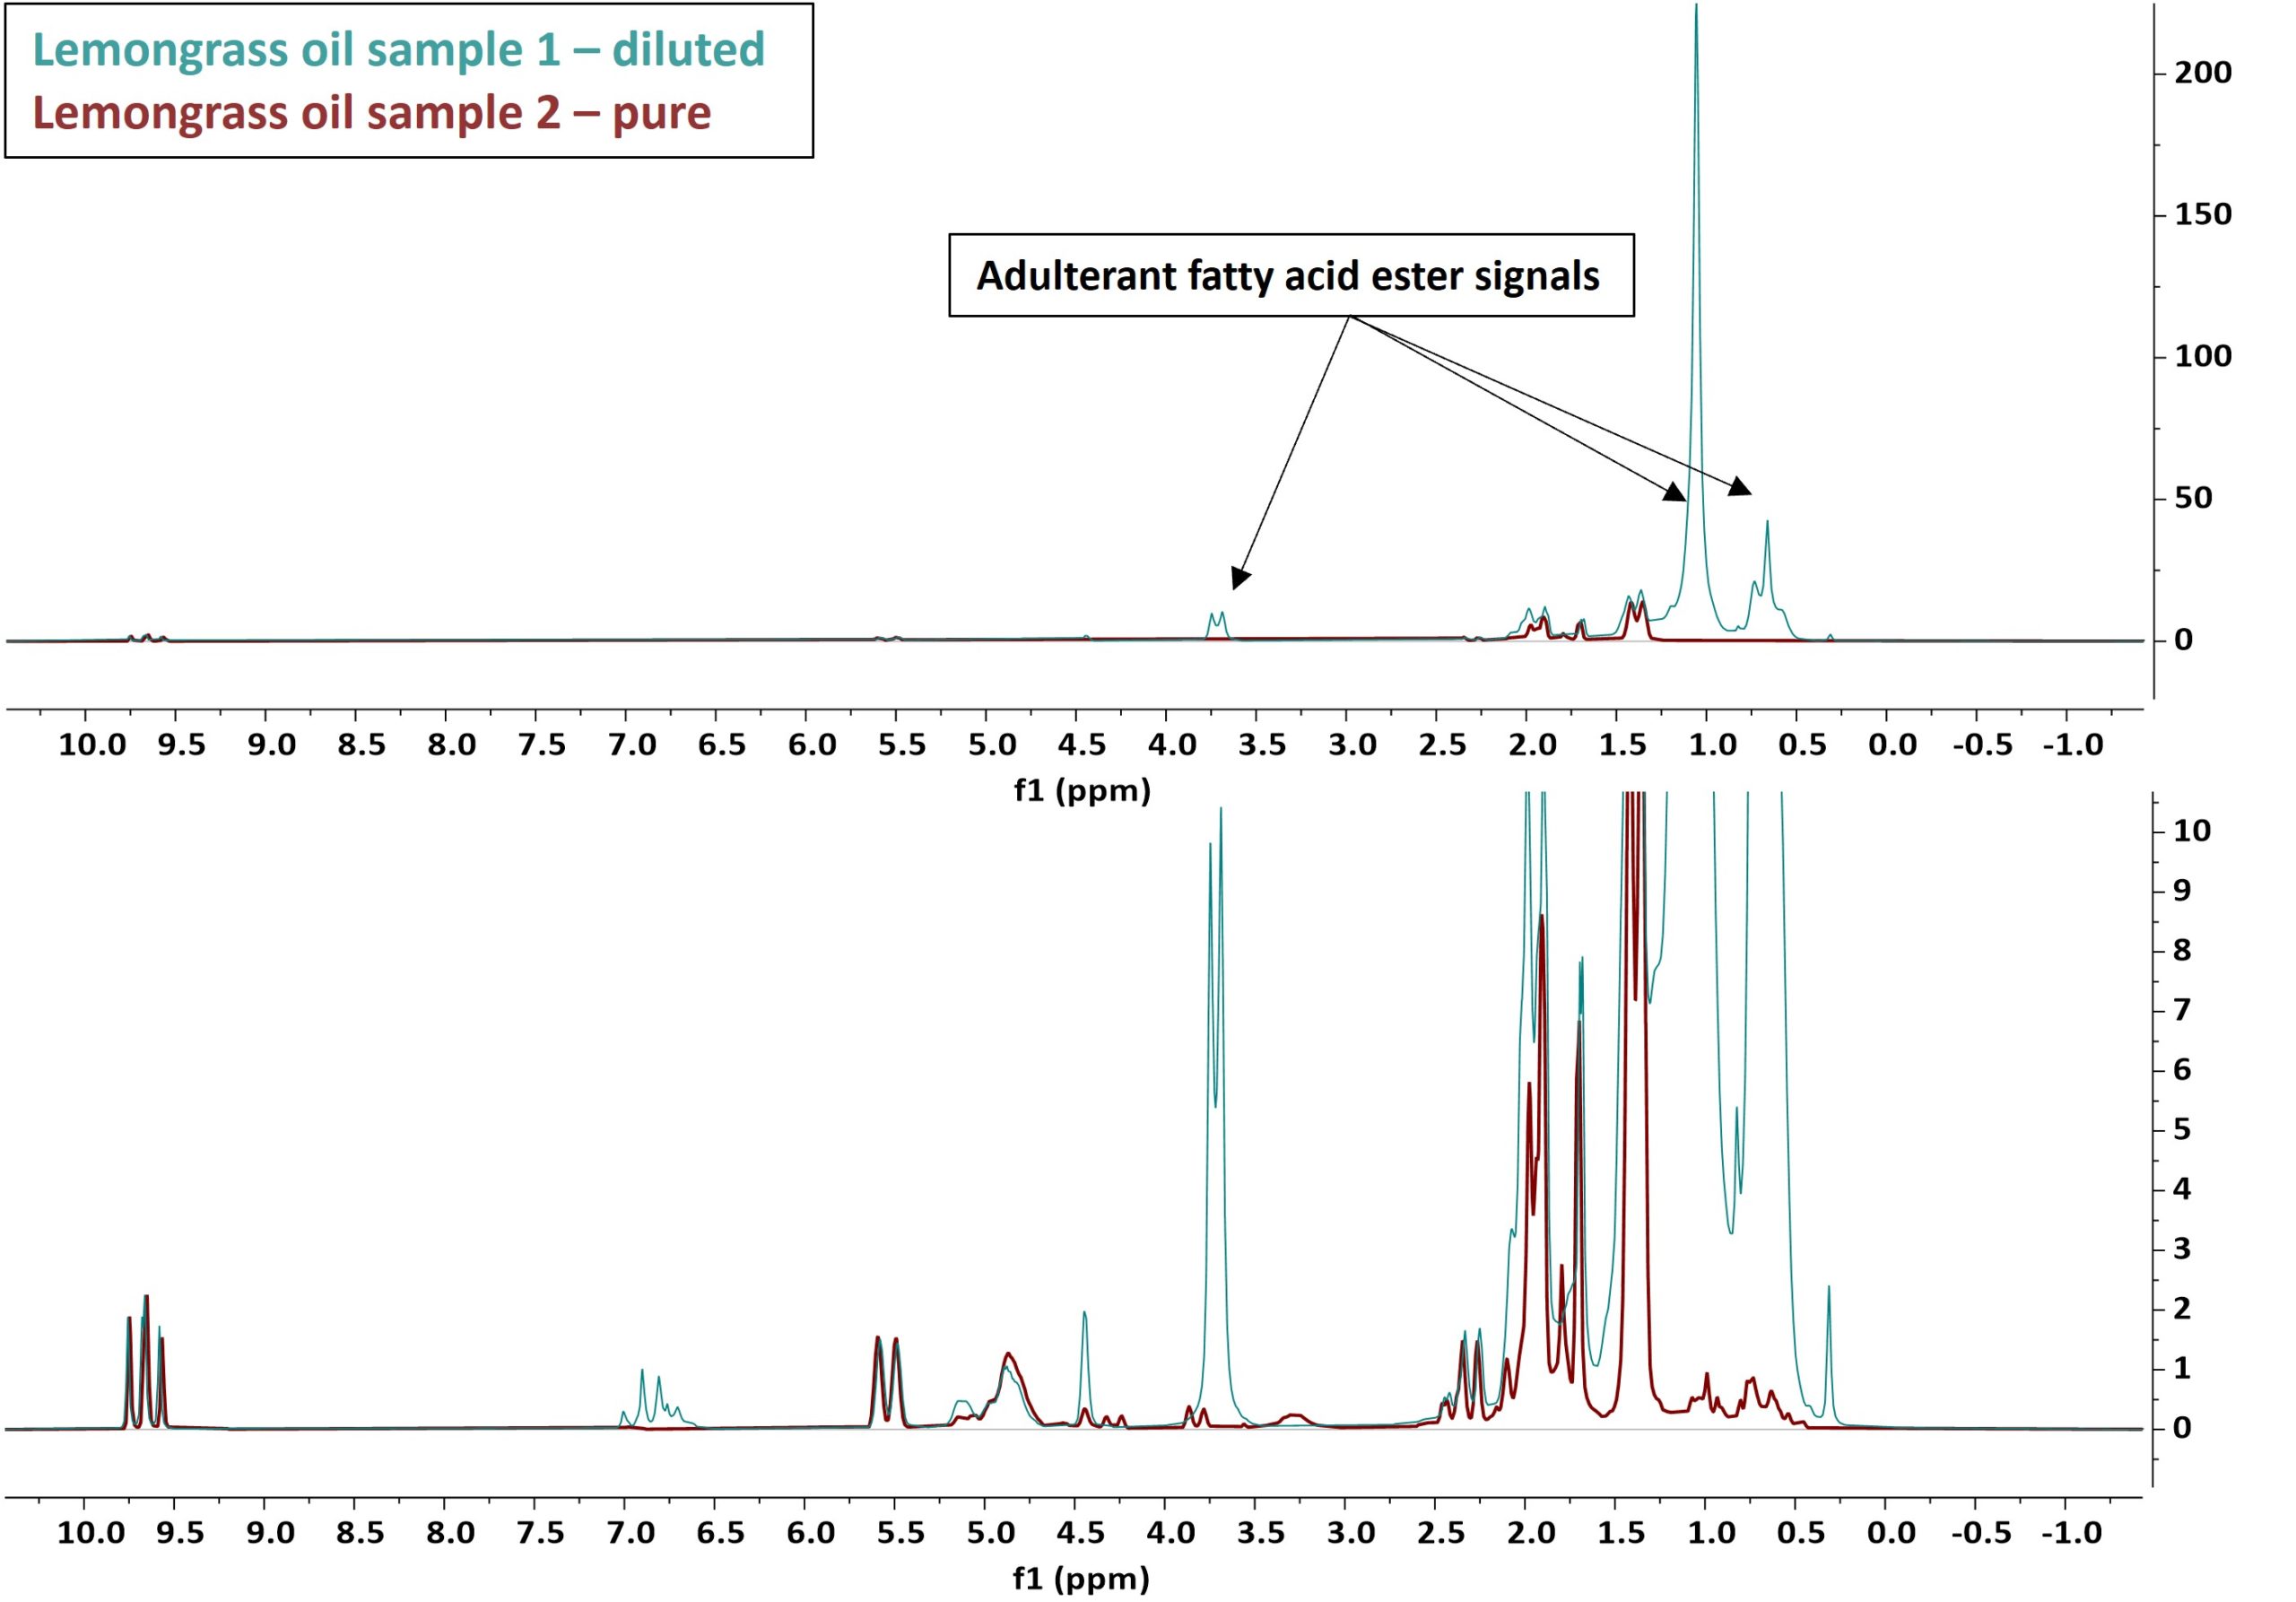
Figure 5: Overlay NMR spectra of two different lemon grass oil samples. The red spectrum shows the pure essential oil, while the cyan spectrum shows a different commercial sample adulterated with a fatty acid ester. The two spectra were normalized to match the amplitude of the essential oil signals.