In a previous blogpost we discussed how copolymer composition can be determine by proton NMR (Blogpost). Polysiloxanes are often used as lubricants and the copolymer ratio has influence on the properties of the polymer, especially on the viscosity and the lifetime, and therefore a thorough characterization is important. The aforementioned method, to determine the composition by proton NMR, is a very effective and straightforward technique, but if the proton signals from the end groups contribute to one of the copolymer signals, an additional error is introduced, which is more significant the shorter the polymer is, and the more protons are at the end groups.
Poly(dimethylsiloxane-co-methylhydrosiloxane), trimethylsilyl terminated (CAS: 68037-59-2) is an example of this kind of polymers (Figure 1).

Figure 1: Chemical structure of poly(dimethylsiloxane-co-methylhydrosiloxane), trimethylsilyl terminated.
A typical 1H-NMR spectrum of this polysiloxane is shown in Figure 2:
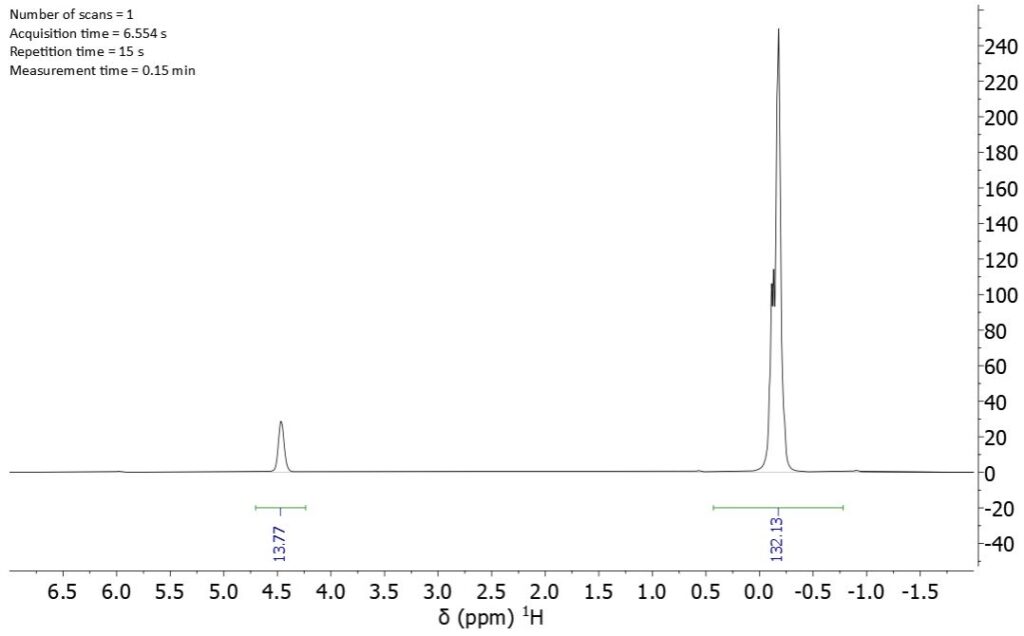
Figure 2: Single scan 1H-NMR spectrum of 68037-59-2 recorded at 80 MHz.
The signals of the silicon bound protons can be seen at 4.4 ppm, whereas the methyl protons of the repeating units and of the end groups appear together in the signal at -0.2 ppm and are not distinguishable from each other. If we ignore the contribution of the end groups, the calculated copolymer ratio SiHCH3/Si(CH3)2 is 0.91 which deviates from the real value of 1.09 measure by 29Si NMR (see below). Although this error is smaller for bigger polymers, even for polymers with an average molecular weight of ~7000 g/mol the error is around 5%.
The larger chemical shift spreading of silicon signals compared to protons signals makes it possible to resolve the signals of the end groups. However, the direct detection of 29Si is time consuming because very long repetition times need to be used. Figure 3 shows the silicon NMR spectrum of 68037-59-2 measured with 1024 scans in 51 h.

Figure 3: Direct detected 29Si-NMR spectrum of 68037-59-2 recorded at 80 MHz in 51 h.
The copolymer ratio can easily be calculated by dividing the integral of the SiHCH3-group at -37 ppm by the integral of the Si(CH3)2-group at -22 ppm to obtain

By setting the integral of the signal of the end groups to two allows one to obtain the average number of both copolymers in a straightforward way. Moreover, the average molecular weight can be calculated according to the following equation

The average molecular weight and copolymer ratio are in agreement with the integrals in the proton spectrum, but this cross check can only be done once the copolymer ration are obtained the silicon spectrum. This is an applicable approach for small chain length, but for larger polymers the reduced concentration of the end groups and the long longitudinal relaxation times of silicon lead to a low SNR per unit of time when silicon is detected directly. This effect can be somewhat circumvented by using relaxation agents such as chromium acetylacetonate, but it has other negative side effects, such as the need to dilute the sample with CDCl3 and broadening the signals.
Calibrating a 29Si-DEPT spectrum
A higher SNR per unit of time can be achieved by measuring the polysiloxanes with a 29Si-DEPT sequence. However, DEPT spectra are not directly quantitative because the magnetization transfer works with different efficiency for different groups. This is shown in the 29Si-DEPT spectrum in Figure 4. Although recorded in just over 20 min with a similar SNR as the direct detected silicon spectrum in Figure 3, the integral ratios between the groups are very different compared to the quantitative spectrum. Especially noteworthy is that the integral ratio of the signals of the two copolymers is 0.79 in the DEPT spectrum instead of 1.09.
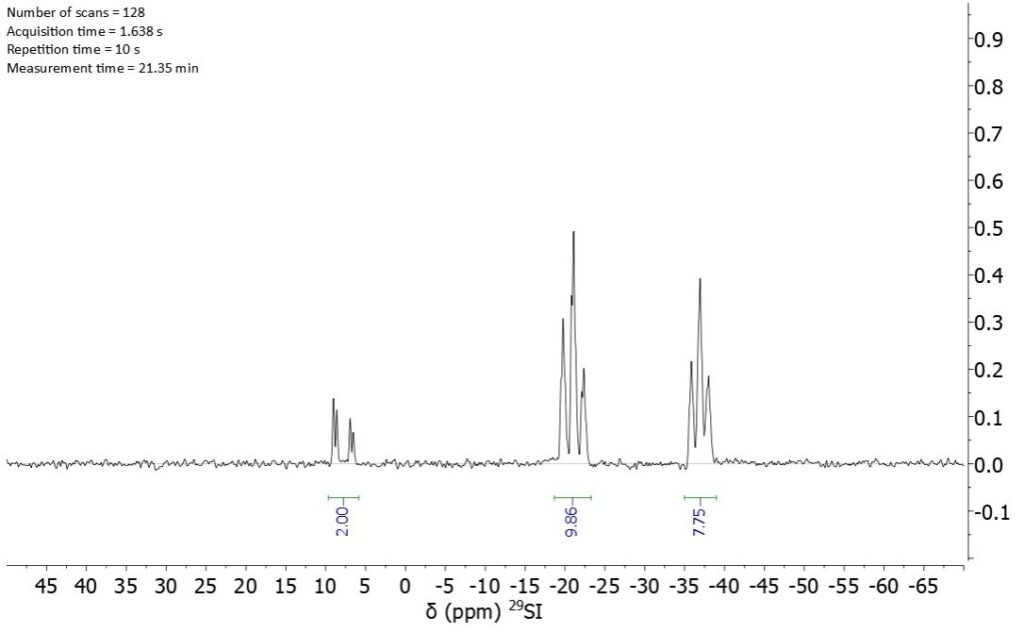
Figure 4: 29Si-DEPT spectrum of 68037-59-2.
The efficiency of the magnetization transfer does not differ for different polymer sizes and by comparing the absolute integral values of the direct detected silicon signals with the DEPT signals, a response factor for each signal can be calculated (Table 1).
Table 1: Calculation of the response factors.

The size of the small polymer allows for the detection of the end group signal and can be used as external reference to calibrate the DEPT spectrum which now enables the complete characterization of longer polymers of the same kind. Figure 5 shows silicon DEPT spectra of polymer variants of 68037-59-2 and the absolute values of the integrals. It is necessary to record the DEPT spectra with the same parameters (repetition time, pulse angle, coupling constant) than the reference DEPT spectrum since these parameters influence the efficiency of the magnetization transfer. The number of scans needs to be adjusted to get enough signal-to-noise ratio for the end groups.
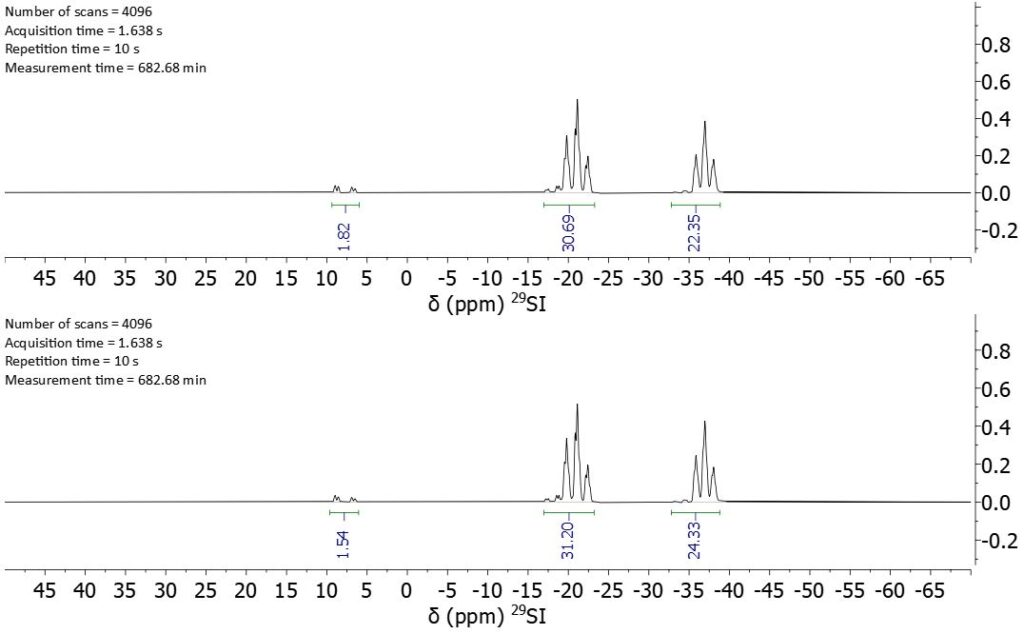
Figure 5: Silicon DEPT spectra of two longer polymers. Polymer 1 at the top and polymer 2 at the bottom.
NMR Results, Validation & Discussion
The response factors from Table 1 are used to transfer the integral values from the DEPT spectra to quantitative values. The integrals of the end groups are then normalized to two and the average molecular weights and copolymer ratios are calculated according to Table 2.
Table 2: Copolymer ratios and average molecular weights calculations of two polysiloxanes 68037-59-2.
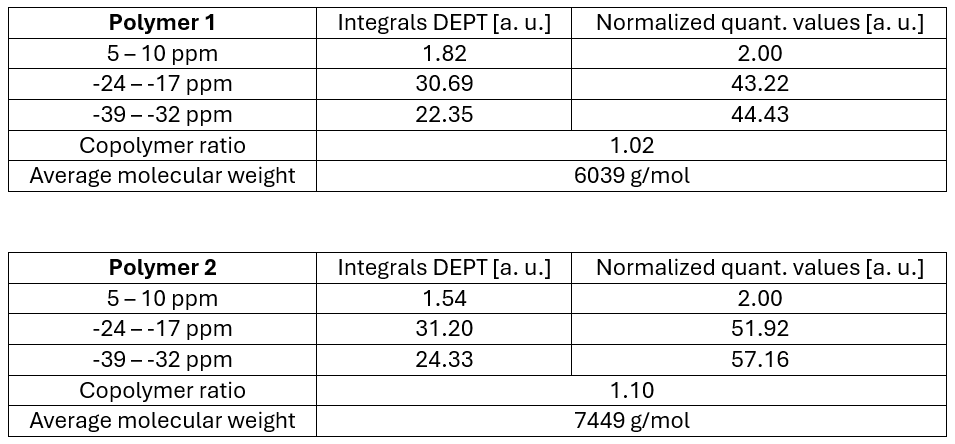
A cross-check for the validity of the presented method is given in Figure 6. Here, directly detected silicon signals, recorded under quantitative conditions with a repetition time of 3 min, display the same copolymer ratios as calculated using the response factors and the DEPT spectra. It is noteworthy that these spectra were recorded in over 25 h each and still not show the signals of the end groups, whereas the DEPT spectra took 11 h to record and give all the needed information.
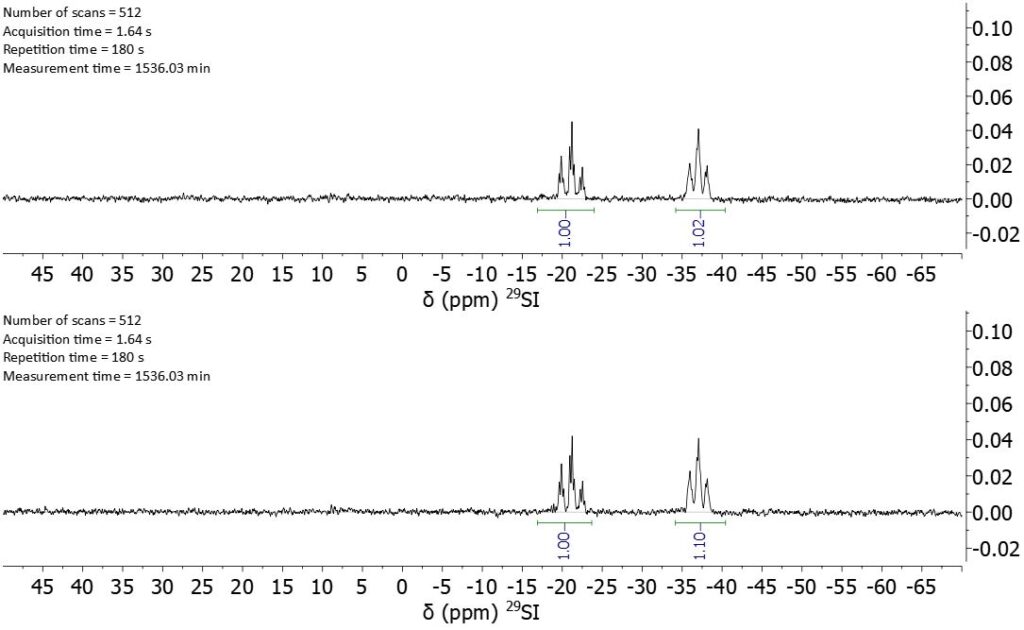
Figure 6: Directly detected 1D silicon spectra of polymers 1 and 2.
In this work we demonstrated how to calibrate DEPT spectra using an external standard to make DEPT measurements fully quantitative. The sensitivity enhancement achieved by the DEPT measurement, compared to the directly detected 1D silicon spectra, enables the full characterization of polymers with sizes that are too large to apply conventional end group analysis. Although here we used silicon DEPT spectra, the same approach can be applied to other nuclei and other NMR methods that involve polarization transfer.
To Read the complete App Note CLICK HERE