In my first two posts on using 1D and 2D NMR methods to assign the peaks of quinine (Figure 1), I looked at the 1H and 13C spectra.
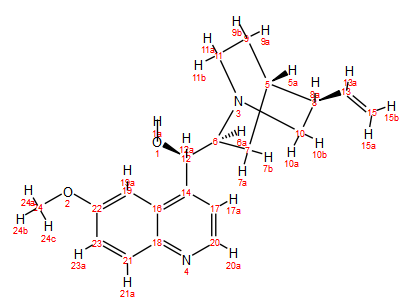
Figure 1. Structure of quinine
In this post, I’m moving on to look at the 1H-13C HSQC spectrum. It’s worth spending a brief moment recapping what HSQC is all about and what info it gives you. In a nutshell, the HSQC experiment correlates proton and carbon chemical shifts over one chemical bond. Another way to put this is that a cross-peak in an HSQC spectrum says, “The proton with this chemical shift is directly attached to the carbon with that chemical shift”. By convention, HSQC spectra are presented with 1H shifts along the horizontal axis and 13C shifts along the vertical axis.
Some variants of HSQC also encode into the phases of the cross-peaks additional information about how many hydrogen atoms are attached to each carbon atom. This is sometimes referred to as multiplicity or DEPT editing. In the multiplicity-edited HSQC spectrum, it is conventional for the CH and CH3 groups to have positive phase, and the CH2 groups to have negative phase, just as in a DEPT-135 spectrum. Figure 2 shows the multiplicity-edited HSQC (“HSQC-ME”) spectrum of our 400 mM quinine sample. The CH2 signals are shown in blue and the CH and CH3 signals in red.
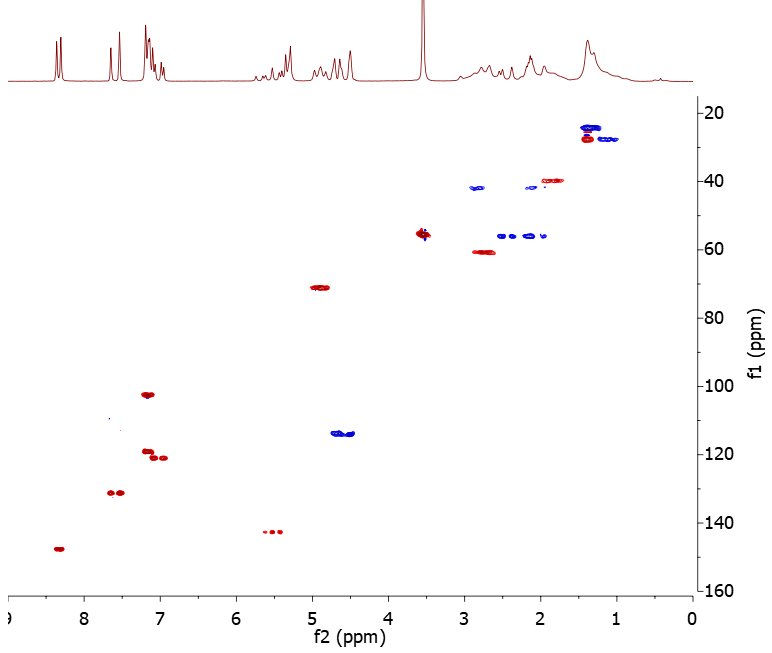
Figure 2. 1H- 13C multiplicity-edited HSQC spectrum of 400 mM quinine. The spectrum was collected using 4 scans, 128 t1 increments and a 1 s repetition time, giving a total experiment time of 17 minutes
A key feature of HSQC and 2D NMR experiments in general is illustrated by Figure 2: by dispersing the signals into two frequency dimensions instead of one the overlap problem is significantly reduced. As we saw in my first post, the 80 MHz 1H spectrum of quinine is quite overlapped, particularly in the aliphatic region from 1-3 ppm. In contrast, each peak in the HSQC is distinct and clearly resolved. The correlation information provided by HSQC, together with the additional signal dispersion, means that what is essentially an impossible assignment problem using the 1D spectra alone becomes readily solvable.
Another important aspect of HSQC that can sometimes be overlooked is that it allows you to obtain the 13C chemical shifts of the protonated carbons without ever having to collect a 13C 1D spectrum. In addition, since HSQC is a proton-detected experiment it can be run in a lot less time than it usually takes to collect a 13C 1D spectrum. Note that the HSQC-ME spectrum of our quinine sample was collected in just 17 minutes, which compares with 26 minutes used to collect the 13C 1D spectrum. The time advantage of HSQC is even more significant for lower concentration (e.g. ~100 mM) samples, where collecting a 1D 13C spectrum may require an overnight or longer run, while a usable HSQC on the same sample can usually be obtained within a couple of hours.
Now let’s do some interpretation of the quinine HSQC-ME spectrum. The first thing to note is that the spectrum shows a number of methylene groups (blue peaks), highlighted with ellipses in Figure 3. Where there appears to be more than one methylene signal with the same 13C chemical shift but different 1H chemical shifts, these are in fact due to non-equivalent methylene hydrogens attached to the same carbon. The HSQC-ME therefore shows five methylene groups in total, which is consistent with the structure of quinine.
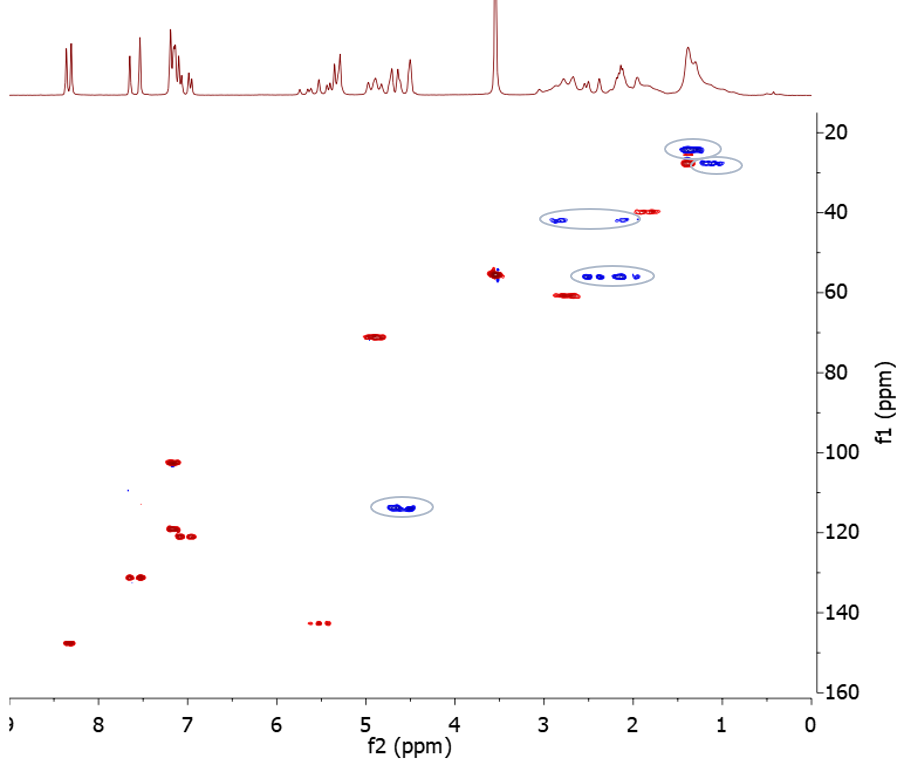
Figure 3. HSQC-ME spectrum with the methylene groups highlighted with ellipses
The HSQC-ME spectrum contains a wealth of structural information and we can make quite a few assignments from it, including:
- All the associated 13C shifts of the protons already assigned in the 1H spectrum.
- The cross-peak at 4.6/114.1 ppm, which was tentatively assigned as H/C15 from the vinyl group can be confirmed as such due to the characteristic 13C shift.
- Similarly, the 1H multiplet at 5.6/142.7 ppm can be assigned to H/C13 from the same vinyl group.
- The doublet at 5.33 ppm in the 1H spectrum shows no cross-peak in the HSQC spectrum, so the hydrogen cannot be attached to carbon – this must be the hydroxyl hydrogen H1.
- The cross-peak at 4.89/71.5 ppm is a methine and tentatively assigned to H/C12 due to the shift downfield of the 1H and 13C resonances by the attached oxygen. We will confirm this with other 2D methods.
- The aromatic cross-peak at 7.16/119.2 ppm shows a well-resolved splitting in the 1H dimension with a measured splitting similar to the 4.5 Hz splitting observed in H20. The other unassigned aromatic cross-peak at 7.16/102.6 ppm shows no resolved splitting. The two peaks are thus tentatively assigned to H/C17 and H/C19, respectively.
The 1H and 13C peaks assignments after analysis of the HSQC spectrum are shown in Table 1.
Atom |
1H (ppm) |
Peak Splitting Pattern |
J (Hz) |
13C (ppm) |
| 24 | 3.55 | — | — | 55.6 |
| 20 | 8.33 | d | 4.5 | 147.6 |
| 21 | 7.59 | d | 9.1 | 131.3 |
| 23 | 7.03 | dd | 9.1, 2.7 | 121.0 |
| 15 | 4.6 | m | — | 114.1 |
| 22 | — | — | — | 157.3 |
| 13 | 5.6 | m | — | 142.7 |
| 1 | 5.33 | d | 5.1 | — |
| 12 | 4.89 | dd | 5.4, 6.9 | 71.5 |
| 17 (tent.) | 7.16 | d | — | 119.2 |
| 19 (tent.) | 7.16 | m | — | 102.6 |
Table 1. 1H and 13C peak assignments obtained from the 1D and HSQC-ME spectra
In my next post I’ll take the peak assignments of quinine further by introducing the COSY experiment.