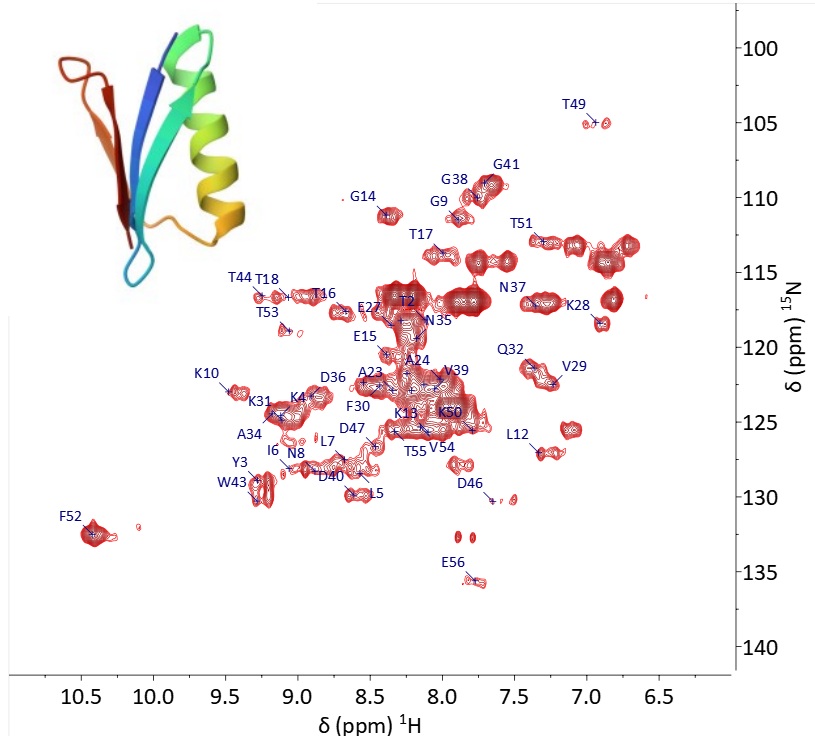
Figure 1. 1H-15N HSQC of 15N-labelled GB1 measured in 9h on a Spinsolve at 80 MHz. The 2D spectrum shows the assignment of the signals for the different amino acids. The structure of the GB1 protein is shown on the top left.
Protein structures and their interactions with other proteins or small molecules such as drugs are routinely assessed by multidimensional NMR spectroscopy. Due to the signal overlap of repeating amino acid units as well as the low natural abundance of the 13C and 15N isotopes this requires isotope labelling with 13C and / or 15N to enable acquisition of 2- and 3-dimensional spectra in a reasonable timeframe.
The most frequently used of the experiments in the protein NMR toolbox is the two-dimensional 1H-15N HSQC NMR, performed on 15N-labelled samples. It provides key data to assess the three-dimensional structure of proteins in solution since it immediately shows if a protein is folded or disordered through the presence or absence of chemical shift dispersion (Figure 2).
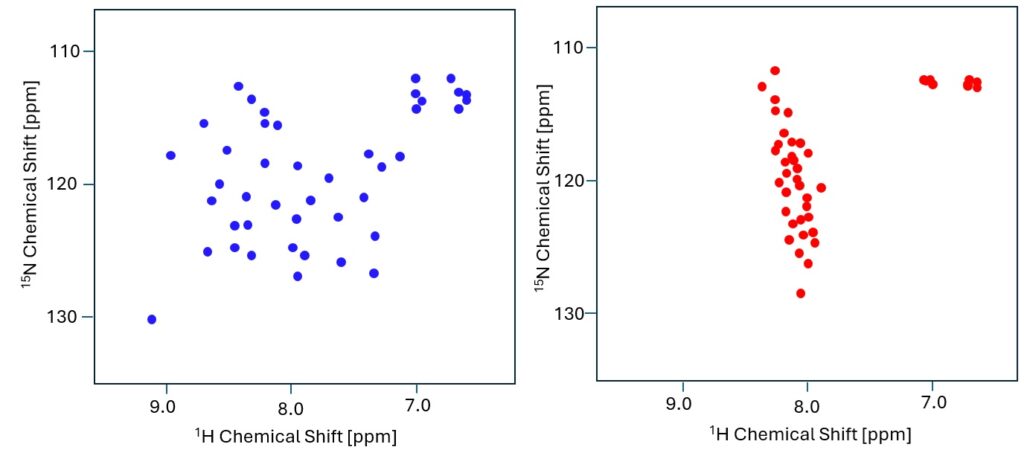
Figure 2. Schematic dispersion of 1H-15N chemical shifts in a folded (left) and an unfolded protein (right)
Traditionally this experiment is performed at high field, generally 500 MHz and above and allows identification of promising targets for both determination of structure by NMR or X-ray crystallography and interaction with potential drugs.
Prof. Roland Riek (ETH Zürich) suggested performing this experiment on a benchtop NMR system and kindly provided a 15N-labelled sample of GB1 protein. Here we show for the first time that the 1H-15N HSQC spectra are accessible on a benchtop NMR system at a protein concentration of 1 mM of 15N-labelled GB1, providing the same valuable structural information as on a high field system for a small protein. GB1 (Figure 1) is a single immunoglobulin binding domain of protein G and consists of 56 amino acids, arranged in an α-helix and a four-stranded β-sheet. It is used both as a model for protein folding studies and as a solubility tag to solubilize insoluble proteins by fusing them to GB1. The spectrum of GB1 was acquired on an 80 MHz Spinsolve Ultra NMR spectrometer with the X-channel tuned for 15N at 8.11 MHz. The 2D spectrum was collected with 256 increments, 64 scans and a repetition time of 1 s, defining a total acquisition time of 9h. The spectrum, including the amino acid assignments, is shown in Figure 1. The dispersion of the signals, mainly in the 1H dimension shows that GB1 is folded in the sample. One feature that is not readily observed at high field is the appearance of scalar couplings between NHs and Hα protons. Figure 3 illustrates how the coupling constants can be measured from the inter-peak distances in the 2D spectrum.

Figure 3. 1H-15N HSQC of 15N-labelled GB1 in phosphate buffer at 80 MHz. Blue arrows mark NH signals split into doublets by the 3JNH-Hα coupling.
Signals marked with a blue arrow show the 3JNH-Hα coupling, which is much more pronounced at lower fields, since its value is larger relative to the frequency axis, than on high field systems, e.g. 8 Hz vs. ~400 Hz for the 1H range of the amide region at 80 MHz, and 2700 Hz at 600 MHz.
To Download the Full App Note CLICK HERE