One of the most widely-used 2D techniques these days is the HSQC (Heteronuclear Single Quantum Correlation) experiment. In the world of “small molecule” NMR, HSQC is most frequently used to correlate protons and carbons over one chemical bond.
A peak in a 2D HSQC spectrum says, “this hydrogen is attached to this carbon”, and so on. This information on its own is extremely useful to chemists in many different ways. However, there are variants of this basic HSQC sequence that go further than “just” providing chemical shift correlations. For example, one such version of the experiment provides information about how many hydrogen atoms are attached to a given carbon atom. To those of you who are familiar with the DEPT experiment this might sound rather familiar, because this “multiplicity” information is exactly what DEPT provides you with; and, just like in a DEPT-135 spectrum, in a multiplicity-edited HSQC spectrum the CH and CH3 signals point one way (say, “up”), while CH2s point the other way (“down”). So in the 2D spectrum you might have your CH and CH3s denoted by certain colours and your CH2s denoted by others. With the HSQC experiment you can get the same—or very similar— information obtained by DEPT, but you can also get a whole load of additional information as well. It tells you how many protons are attached to each carbon, and you also get the correlations between the chemical shifts.
Another important advantage of multiplicity-edited HSQC experiment: you can often get the chemical shift correlation and multiplicity information in significantly less time than you can in running a carbon-detected experiment such as DEPT. There are many instances where you can obtain a nice HSQC spectrum quite easily, whereas to get acceptable signal-to-noise with DEPT can take significantly longer.
To illustrate the usefulness of the multiplicity-edited HSQC experiment, Fig. 1 below shows an HSQC spectrum of a sample of 200 mM ibuprofen in CDCl3, collected on a Spinsolve Carbon NMR spectrometer. 128 t1 increments, each comprising 8 scans and 1024 complex points, were recorded using a recycle time of 2 s. F1 and F2 spectral widths were 2500 Hz and 2000 Hz, respectively, giving an overall acquisition time of 68 minutes.
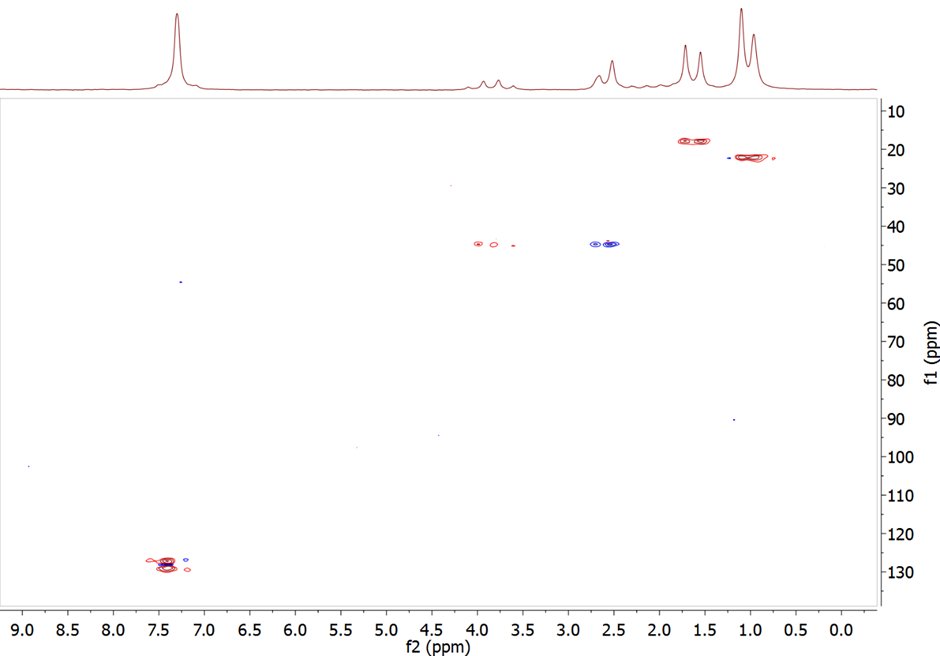
In the 2D spectrum shown above the red peaks denote CH3 or CH signals, while the blue signal denote CH2 signals. Using the proton integrals and chemical shifts it is straightforward to differentiate between CH3 and CH – there is simply no need to run a DEPT experiment here. Another interesting feature of this spectrum is that it clearly shows that the carbon signal at 44 pm is, in fact, two different carbon signals with near-identical chemical shifts – one of those carbon atoms bears two hydrogens, indicated by the blue signal at ca. 2.6 ppm, while the other carbon bears one hydrogen, given by the red signal at ca. 4 ppm. By contrast, the DEPT-135 spectrum rather confusingly shows no signal at 44 pm due to cancellation of these positive- and negative-going signals.