Determining the Salt Stoichiometry of Pharmaceutical Compounds
Posted at
August 6, 2026
by
Jasmin Wloka
Determining the Salt Stoichiometry of
Pharmaceutical Compounds
Why Salts Matter
Many active pharmaceutical ingredients (APIs) are produced as salts rather than free bases or acids to provide more desirable physico-chemical properties. The choice of counterion allows tailoring of solubility and dissolution profiles as well as product stability, depending on the required bioavailability. Therefore, screening a wide range of salts with different counterions for an API is common practice and usually involves chemists, analysts and formulation as well as solid form specialists to develop the optimal salt or cocrystal for the desired release behaviour, drug product stability and ease of manufacture.
Figure 1:Schematic representation of a salt (left) and a cocrystal (right).
Once a specific salt has been chosen, the constant ratio of drug or intermediate and counterion is critical for achieving consistent product quality, and it is often included in the specifications, either directly or via the API assay. NMR is ideally suited to check the interaction between drug and counterion and quantify the ratio of API to counterion during the screening process and assay, with the option to implement the quantitation as a routine method.
Salt Stoichiometry of Lamivudine Salicylate
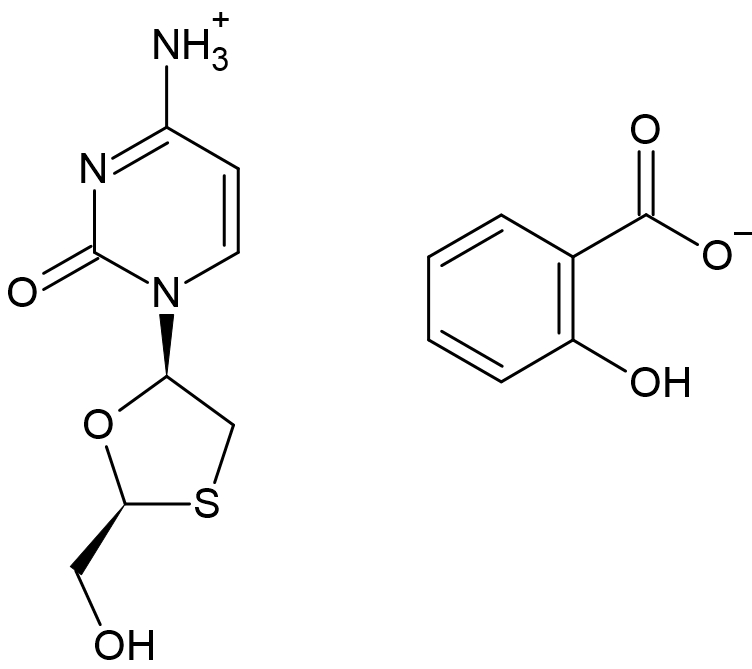
In this application note we show the analysis of an API salt, lamivudine salicylate (kindly provided by Msizi Pharmaceuticals), by benchtop NMR. Lamivudine (Fig. 2) is an antiretroviral drug for the prevention and treatment of HIV/AIDS and hepatitis B, acting by inhibiting the reverse transcriptases of HIV-1 and the hepatitis B virus. Salicylate is one of several commonly used API salts.
Figure 2: Structure of lamivudine salicylate.
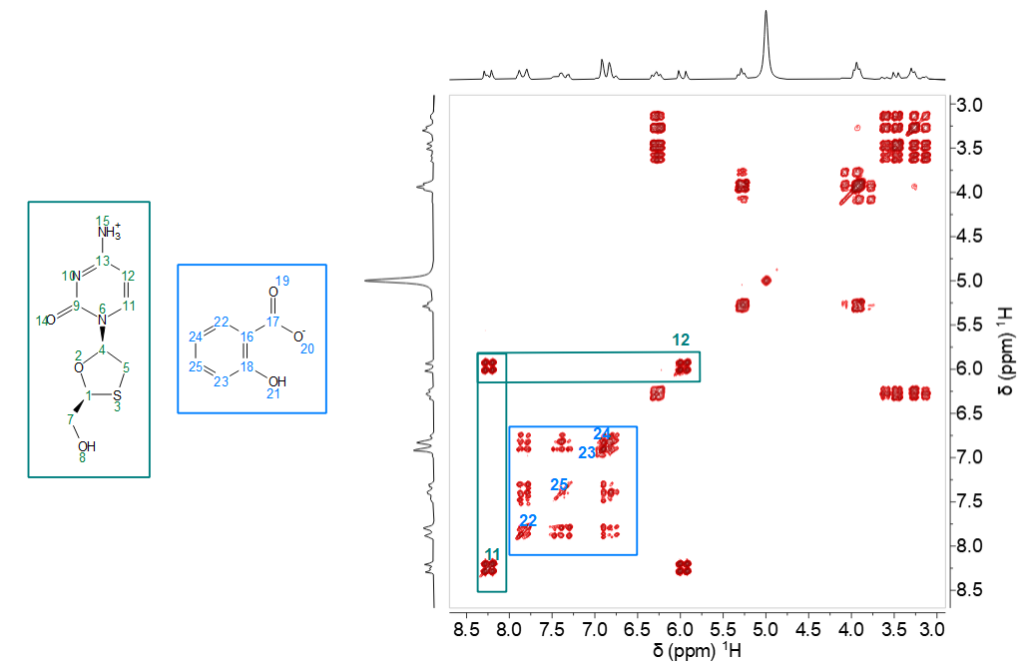
A 1H,1H COSY of the salt in CD3OD helps to distinguish between the aromatic signals of lamivudine and the counterion (Fig. 3).
Figure 3:1H,1H COSY of lamivudine salicylate (300 mM in CD3OD, Spinsolve Ultra MultiXn 90 MHz, one scan, 512 increments,
50% non-uniform sampling (NUS), 4.7 min), indicating the signals for both molecules.
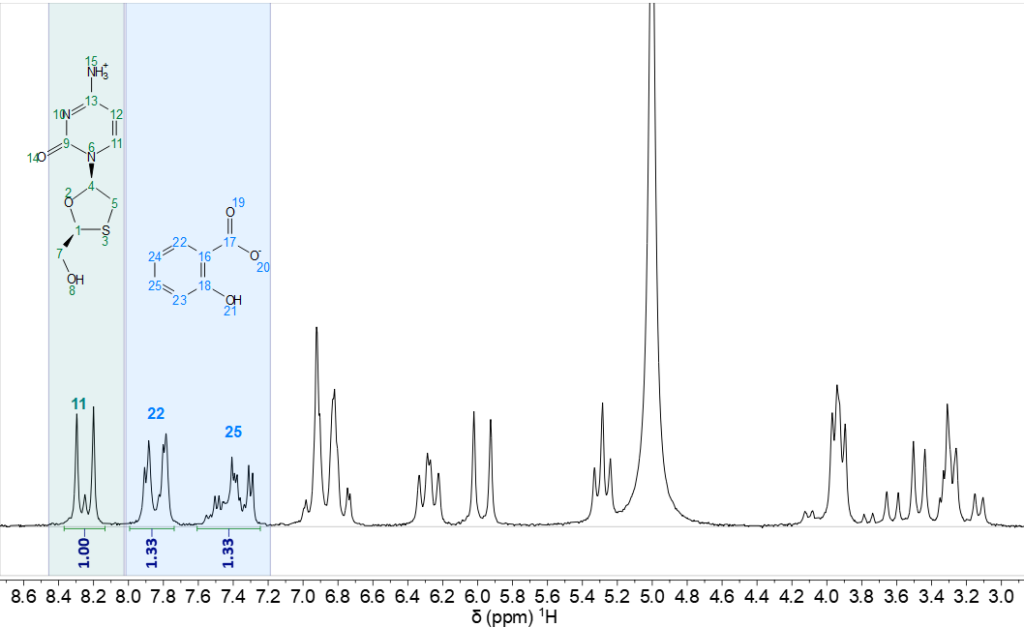
The signals of both molecules are clearly separated, making it straightforward to determine the ratio between API and counterion by integrating the respective signals in the 1D 1H NMR spectrum (Fig. 4).
Figure 4:1D 90 MHz 1H NMR spectrum (Spinsolve Ultra MultiXn 90 MHz, four scans, 15 s repetition time) of lamivudine salicylate (300 mM in CD3OD), with colour-coding for the signals and integrals for API and counterion.
Each of the integrated signals corresponds to one proton, which immediately yields a ratio of 1:1.3 for API:salicylate.
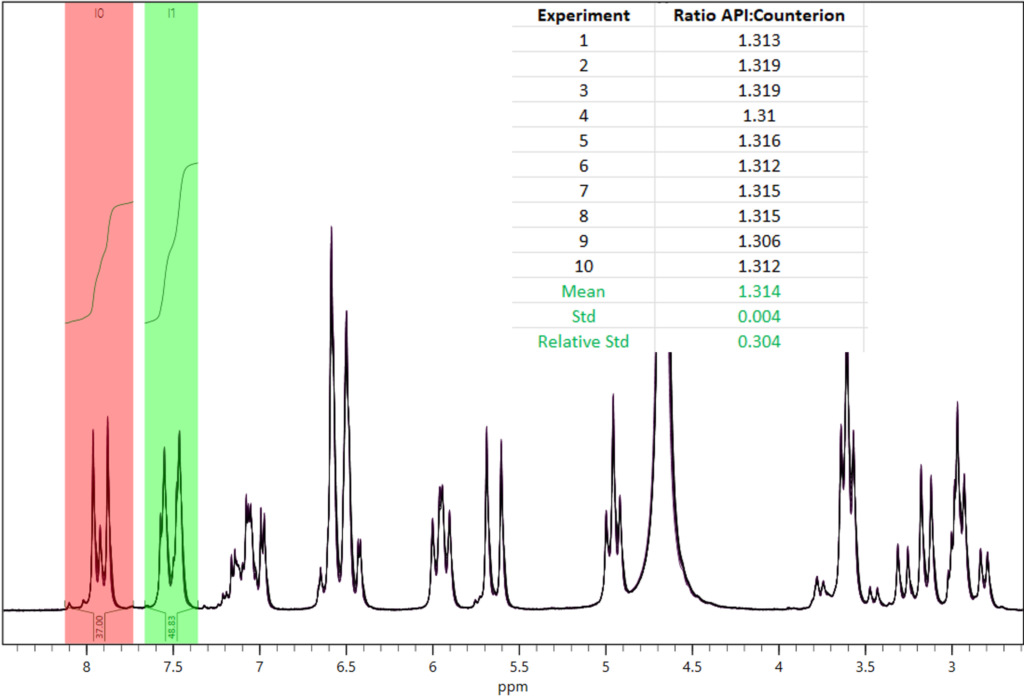
Fig. 5 summarises the results of ten measurements which demonstrate excellent repeatability.
Figure 5:Overlay of ten 1H NMR spectra of lamivudine salicylate (300 mM in CD3OD); inset: API:counterion ratio and showing excellent repeatability.
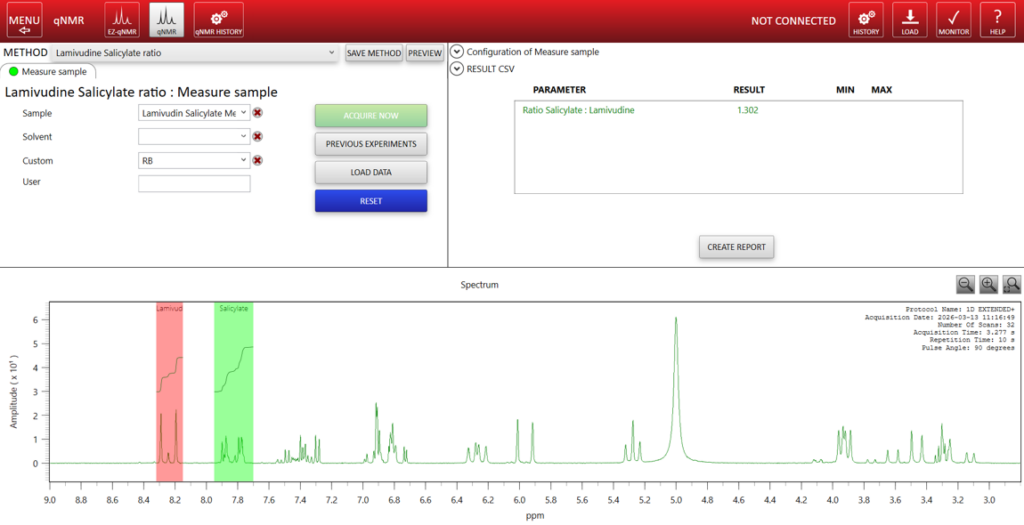
It is easy to implement a qNMR method (Fig. 6) for this, which will automatically run samples, process and analyse the data and provide a report with the results.
Figure 5:qNMR method for automatically measuring and analysing salt stoichiometry.