
Cyclodextrin Drug Inclusion Using Benchtop NMR
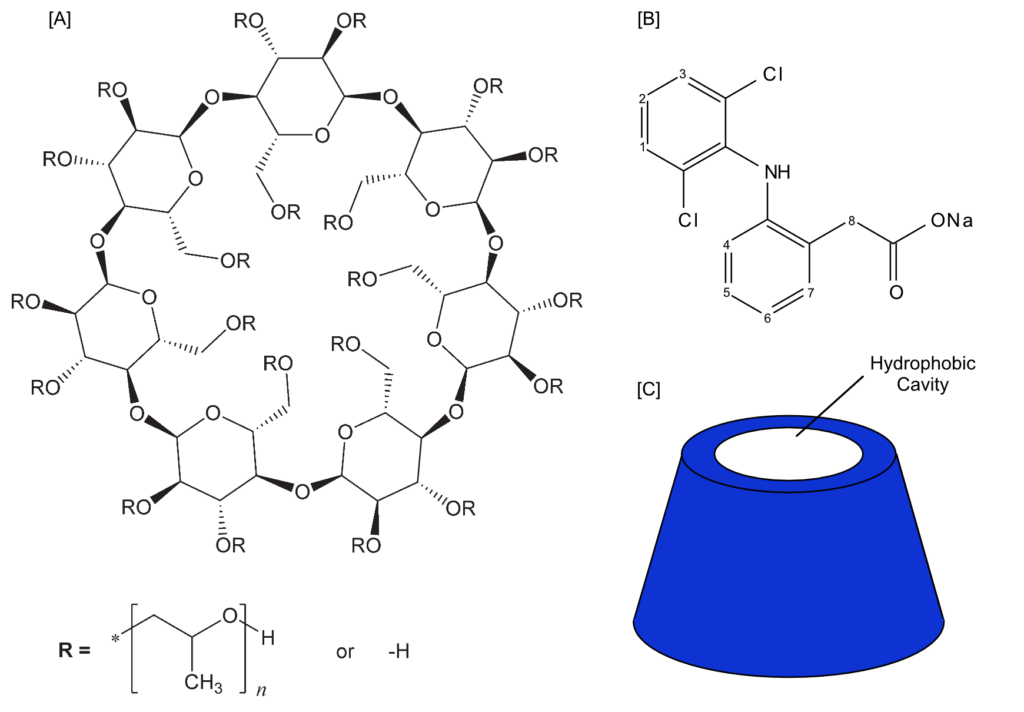
Figure 1: Structure of 2-hydroxylpropyl-β-cyclodextrin [A], sodium diclofenac [B], and general three dimensional structure of cyclodextrins [C].
Cyclodextrins (CDs) are cyclic oligosaccharides composed of repeating glucose subunits. CDs have become cornerstones of modern pharmaceutical formulation due to their unique ability to enhance properties of drug molecules such as solubility, stability, and bioavailability of guest drug molecules, while simultaneously masking unpleasant tastes and odors.1 CDs form truncated cone structures with slightly hydrophobic cavities whose size depend on the number of repeating glucose subunits (Figure 1C). Drug molecules can then be included into this hydrophobic cavity, which results in enhanced drug molecule properties. A key challenge in cyclodextrin-based formulation is the rapid and reliable confirmation of inclusion complex formation and geometry during early-stage screening. Conventional techniques provide indirect or time-intensive insights, creating a bottleneck in formulation workflows. For formulation chemists, the ability to confirm inclusion and gain structural insight within minutes directly supports high-throughput formulation screening, reducing reliance on time-intensive orthogonal techniques. While techniques like DSC and FTIR are staples for confirming inclusion, they lack the structural resolution to determine spatial orientation. XRD offers high resolution but requires lengthy and demanding sample preparation.2 NMR provides complementary molecular-level insight that is not accessible by techniques such as DSC or FTIR, while requiring significantly less sample preparation than XRD. First, simple 1D 1H NMR can be utilized as a rapid screening tool for initial evidence of inclusion. On initial inclusion is indicated, 2D Diffusion Ordered SpectroscopY (DOSY) can be applied to unambiguously confirm that the host and guest coexist as a single complex. Finally, 2D ROESY can be performed to definitively map the orientation and geometry of the guest drug within the CD cavity. A prime example of this application is found with sodium diclofenac (Figure 1B), a potent anti-inflammatory drug. Despite its efficacy, its clinical use in aqueous solutions is hampered by low solubility and poor dermal absorption. By complexing diclofenac with 2-hydroxypropyl-β-cyclodextrin (2-HPβCD, Figure 1A), these limitations can be significantly mitigated. This application note demonstrates how the Spinsolve benchtop NMR at 80 MHz can be used to confirm and characterize the formation of the inclusion complex between sodium diclofenac and 2-HPβCD.
Molar Substitution Determination of 2-HPβCD
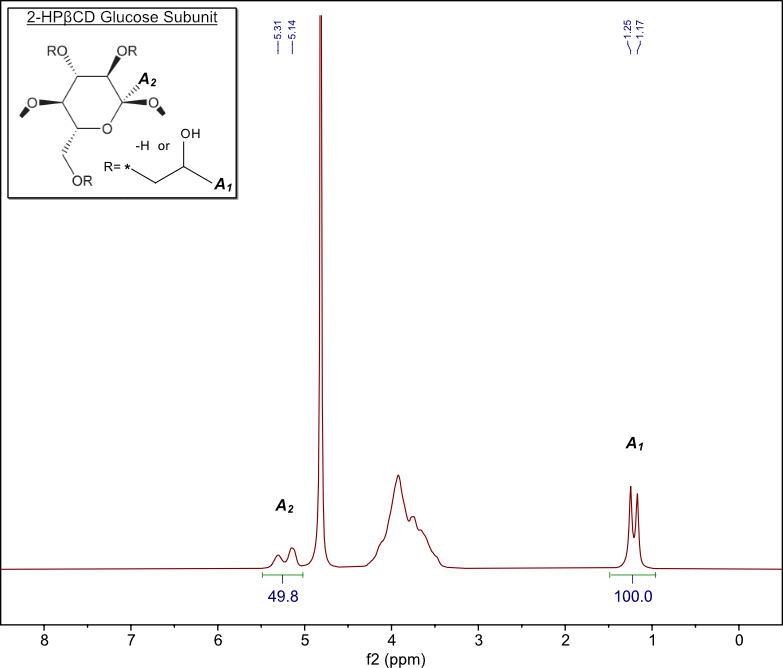
Figure 2: 1D 1H spectrum of 2-hydroxypropyl-β-cyclodextrin in D2O showing normalized integrals of the methyl protons of the hydroxypropyl functional groups (A1) and the glycosidic protons (A2) acquired on an 80 MHz Spinsolve benchtop spectrometer.
Prior to assessing the inclusion of drug molecules into cyclodextrin hosts, Beyond inclusion analysis, benchtop NMR also supports routine excipient characterization, including determining the molar substitution (MS) of 2-HPβCD. This value represents the ratio of hydroxypropyl functional groups to anhydroglucose units and may be assessed using NMR per United States Pharmacopeia – National Formulary (USP-NF) Monograph.3 While the USP-NF monograph specifies higher-field instrumentation, the results obtained here demonstrate that benchtop NMR can achieve comparable accuracy for routine quality control tasks, significantly lowering the barrier to implementation.. A 15mg/mL sample of 1380 average molecular weight (MS = 0.7) 2-HPβCD was prepared in D2O and analyzed on an 80 MHz Spinsolve benchtop spectrometer (Figure 2). The doublet at 5.2 ppm (A2) is the glycosidic proton while the doublet at 1.2 ppm (A1) is the methyl protons of the substituted hydroxypropyl functional group of the β cyclodextrin subunit. The integral values of these peaks can be used to calculate the MS using the following equation:
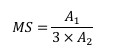
Using the integrals shown in Figure 2, an MS value of 0.67 is obtained, which confirms the labeling (MS=0.7) and is within the established acceptance criteria based on USP-NF guidelines (within 10% of the value stated on the label).
1H Spectroscopy as an Inclusion Screening Tool
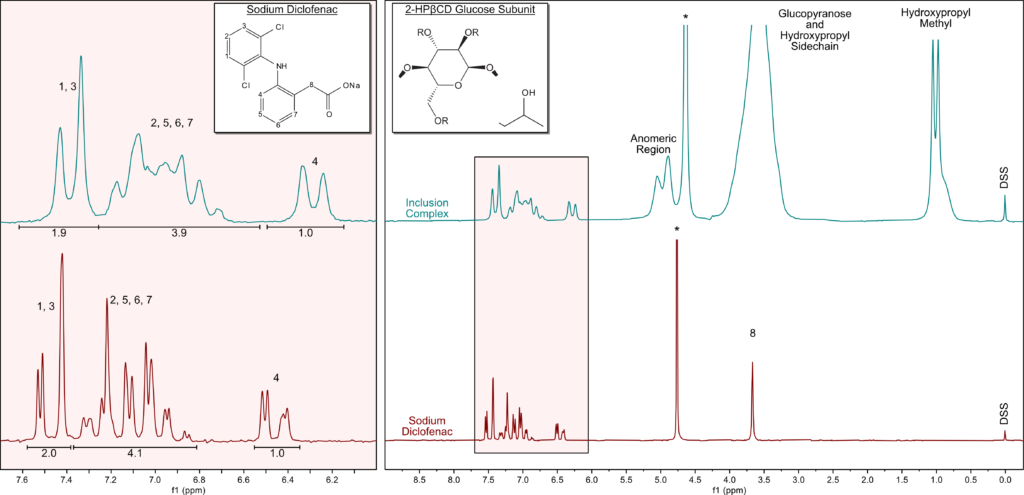
Figure 3: Stacked 1H spectra of sodium diclofenac (red) and the sodium diclofenac-2-HPβCD Inclusion Complex (blue) in D2O acquired on an 80 MHz Spinsolve benchtop spectrometer.
When diclofenac forms an inclusion complex with 2-HPβCD, the chemical shifts belonging to diclofenac change, with the largest changes occurring for the protons inside the 2-HPβCD cavity. To rapidly screen for inclusion, 75 mg of sodium diclofenac was added to 1 mL of D2O, heated to 60 °C, and stirred while 160 mg of 2-HPβCD in 2 mL of D2O was added dropwise over 5 minutes. The solution was cooled and 500 µL of the solution was added to an NMR tube. Figure 3 shows a comparison of the aromatic region between the complex (Figure 3A) and sodium diclofenac (Figure 3B) in D2O at its solubility limit (25 mg/mL) using 8 scans for a total experiment time of only 2 minutes. While some of the multiplets are overlapped (those corresponding to H-2, H-5, H-6, and H-7) and not suitable for analysis, peaks corresponding to H 1, H-3, and H-4 are well-resolved and show significant chemical shift changes. Additionally, the observed lineshape broadening for the aromatic peaks suggests the diclofenac is now a part of a larger, more rigid complex with the 2-HPβCD with a shorter transverse relaxation time. Furthermore, these changes in the aromatic region suggest that the aromatic rings of the diclofenac sit inside the 2-HPβCD cavity when the inclusion complex is formed. With this new information obtained in under 5 minutes of total NMR experiment time suggesting that the inclusion complex is forming, we can now use further NMR experiments to understand the orientation in which the guest sodium diclofenac is being included into the host 2-HPβCD.
Diffusion Ordered SpectroscopY (DOSY)
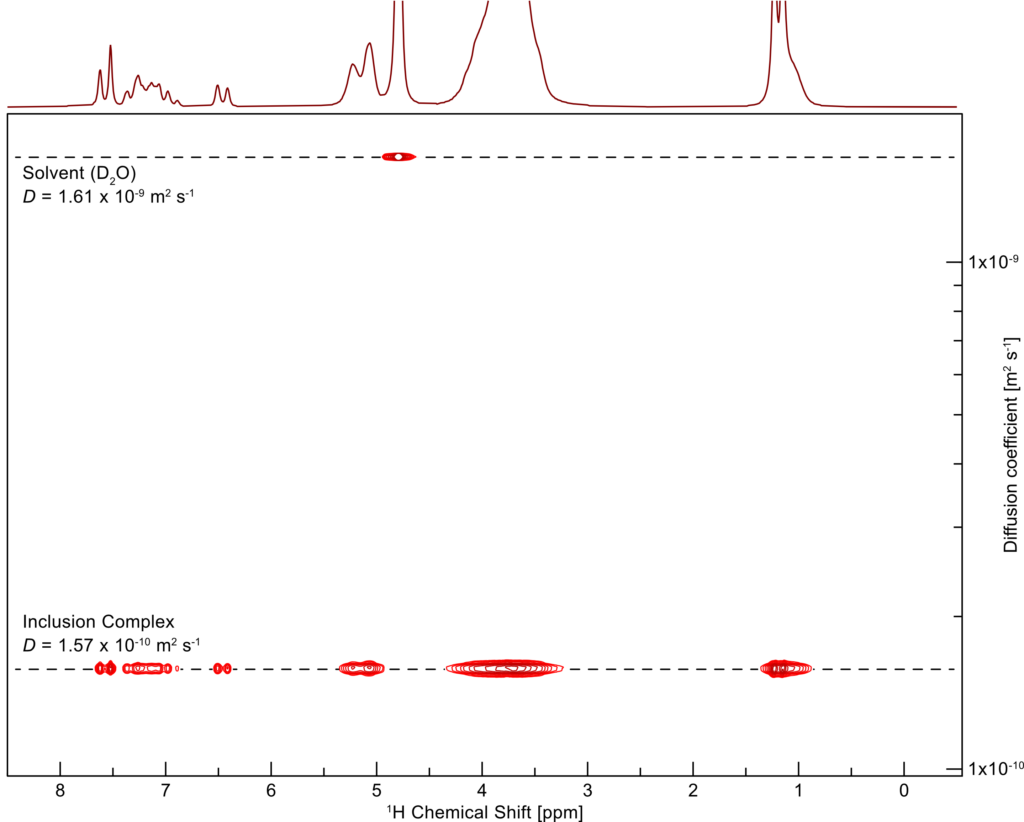
Figure 4: 2D DOSY plot of the diclofenac/2-HPβCD inclusion complex in D2O at 80 MHz. The crosspeaks corresponding to both guest diclofenac (6-8 ppm) and host 2-HPβCD (0.5-4.5 ppm and 5-5.5 ppm) lie along the same diffusion axis (1.57 x 10⁻¹⁰ m2 s-1) confirming the formation of a single entity. The additional crosspeak at 4.80 ppm corresponds to the solvent.
While 1D 1H chemical shift perturbations and linewidth broadening provide compelling evidence of interaction, they cannot definitively prove complex formation. To unambiguously confirm complexation, 2D Diffusion Ordered SpectroscopY was utilized to measure the diffusion coefficients of the individual components using a Pulsed Gradient Stimulated-Echo (PGSTE) experiment. Components of a mixture diffuse at distinct rates primarily dictated by their respective molecular weight and effective hydrodynamic radius. Free sodium diclofenac (318 g/mol) and free 2-HPβCD (1380 g/mol) possess vastly different molecular weights and would exhibit distinct diffusion rates. However, in the DOSY plot collected for this system (Figure 4), the crosspeaks corresponding to both sodium diclofenac (6-8 ppm) and the 2-HPβCD (0.5-4.5 ppm and 5-5.5 ppm) are perfectly aligned along the diffusion axis. Both components share an identical diffusion coefficient of 1.57 x 10⁻¹⁰ m2 s-1, confirming that they move as a single complex. The only other distinct signal appears at 4.80 ppm with a much faster diffusion coefficient of 1.61 x 10⁻⁹ m2 s-1which corresponds to the solvent D2O. The shared diffusion coefficient establishes definitive proof of host-guest inclusion complexation.
Rotational nuclear Overhauser Effect SpectroscopY (ROESY)
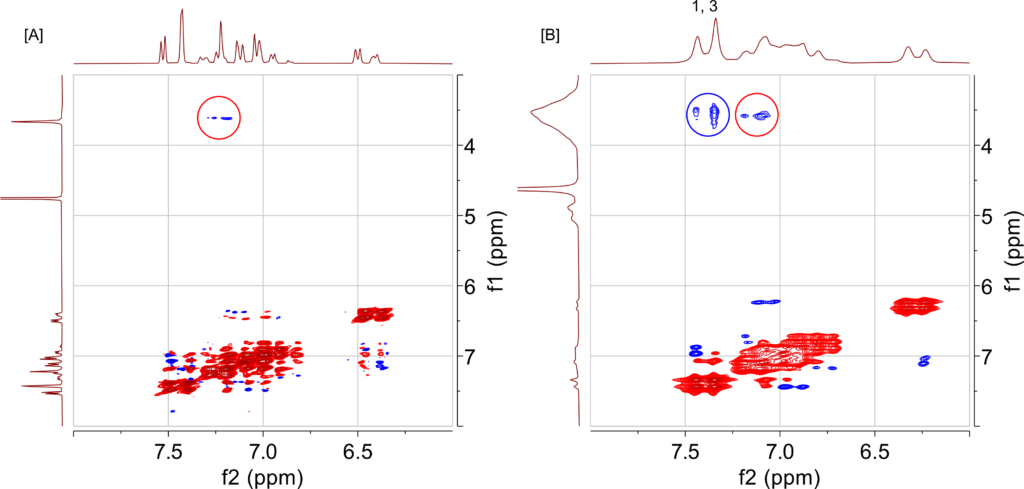
Figure 5: ROESY spectra of Sodium Diclofenac (A) showing intramolecular coupling between the methylene protons (3.7 ppm) and aromatic protons (7.3 ppm) circled in red and the inclusion complex (B) showing an additional through-space intermolecular coupling between the 2-HPβCD cavity protons (3.6 ppm) and the sodium diclofenac H-1 and H-3 protons (7.4 ppm) circled in blue.
With complexation firmly established by DOSY analysis, ROESY (Rotational nuclear Overhauser Effect SpectroscopY) was subsequently employed to map the spatial three-dimensional architecture of the complex. ROESY is a 2D NMR technique that shows through-space (< 5Å) correlations between protons which can be extracted to yield 3D structural information rendering it an invaluable tool for validating binding geometry. Figure 5A shows a ROESY spectrum of sodium diclofenac (25 mg/mL) in which the crosspeak circled in red corresponds to an intramolecular coupling between the methylene protons (H-8) at 3.7 ppm and the adjacent aromatic proton (H-7) in sodium diclofenac. Unlike the sodium diclofenac ROESY spectrum, the ROESY spectrum of the inclusion complex (Figure 5B) shows an additional intermolecular crosspeak corresponding to the interaction of the sodium diclofenac H-1 and H-3 protons to the 2-HPβCD cavity protons (circled in blue), confirming that the 2,6-dichlorophenyl group of the sodium diclofenac is being included into the hydrophobic cavity of the 2-HPβCD.
Conclusion
This study shows that the Spinsolve 80 MHz benchtop NMR is an effective tool for rapidly assessing drug product inclusion complexes and gives rich data in a fraction of time compared to other analytical techniques such as DSC, FTIR, and XRD.2 Molar substitution values of 2-HPβCD were confirmed using the method established by USP-NF, despite being performed at a lower magnetic field than suggested by USP-NF. The high resolution and sensitivity afforded by the 80 MHz Spinsolve allowed for observation of chemical shift and linewidth changes between sodium diclofenac and the inclusion complex in under 5 minutes, allowing for rapid screening of inclusion complex formation. By implementing diffusion and 2D DOSY analysis, scientists can explicitly validate complexation by monitoring diffusion coefficients across all active components. Finally, 2D ROESY was used to confirm inclusion and determine orientation of the sodium diclofenac guest drug into the 2-HPβCD host molecule. This comprehensive workflow could be extended to quantify binding interactions (e.g., via NMR titration), highlighting the broader applicability of benchtop NMR beyond structural confirmation. The compact footprint enables at-line analysis directly in the formulation laboratory, aligning with modern process analytical technology strategies. Taken together, the Spinsolve benchtop NMR is a practical tool that enables rapid and accessible analysis for formulation chemists by enabling drug inclusion analysis to be performed conveniently and in a timely manner right on the lab bench.
References
[1] Gergely Kali, Soheil Haddadzadegan, Andreas Bernkop-Schnürch, Cyclodextrins and derivatives in drug delivery: New developments, relevant clinical trials, and advanced products, Carbohydrate Polymers, Volume 324, Issue 1, January 2024, Page 121500, https://doi.org/10.1016/j.carbpol.2023.121500
[2] Shuhan Li, Yue Tang, Xinru Zhang, Yushun Duo, Xiangchun Shen, Preparation and characterization of diclofenac sodium β cyclodextrin inclusion complex eye drops, Journal of Inclusion Phenomena and Macrocyclic Chemistry, Volume 94, Issue 1, May 2019, Pages 85-94, https://doi.org/10.1007/s10847-019-00910-0
[3] Hydroxypropyl Betadex (2025), United States Pharmacopeia – The National Formulary, Rockville, MD, USA, https://doi.org/10.31003/USPNF_M39130_07_01.
To get the complete App Note please Click Below